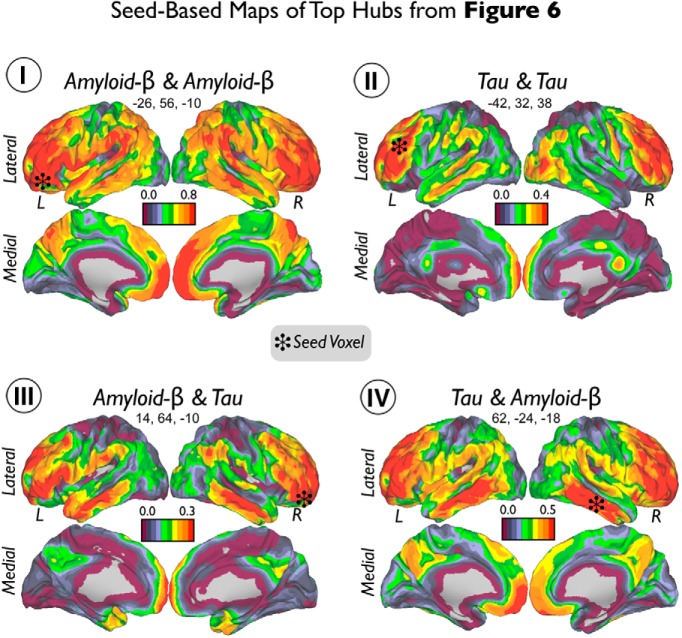
Figure 7.
Seed-based maps of top hubs from Figure 6. Seed voxels of top hubs of Aβ–Aβ (I), Tau–Tau (II), Aβ–Tau (III), and Tau–Aβ (IV) are marked with black stars. Color scales represent positive partial correlation coefficients between Tau and Aβ adjusted by age, GM, and Aβ or Tau intensities depending on the analysis.

