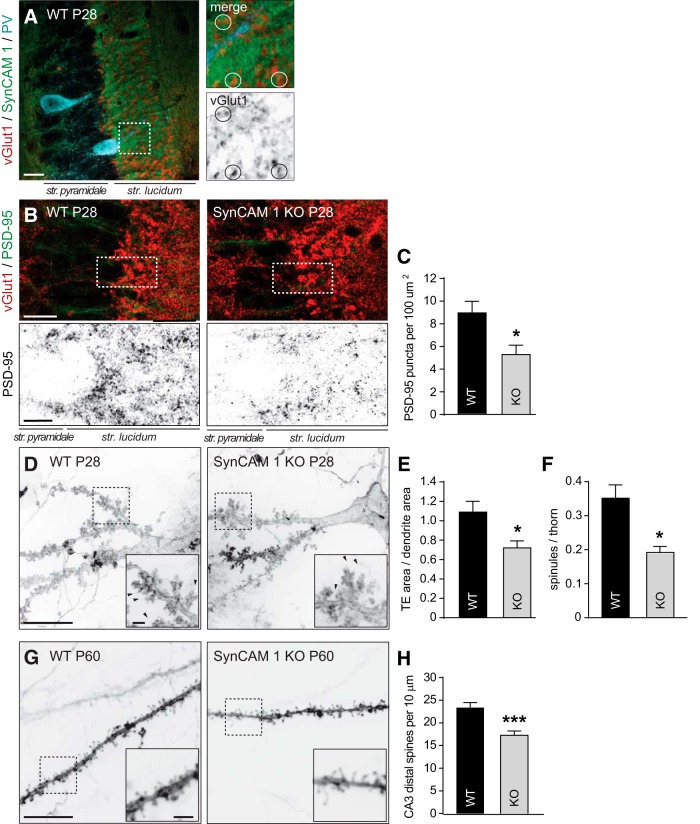
Figure 3.
Excitatory postsynaptic changes in the CA3 area of SynCAM 1 KO mice include smaller TEs and fewer distal spines in pyramidal neurons. A, Left, Immunostaining of a hippocampal tangential section from WT mice at P28 labeled with anti-vGlut1 (red), anti-SynCAM 1 (green), and anti-PV (cyan) antibodies. A maximum projection of 3 optical sections taken at 0.5 μm intervals obtained by high-resolution confocal microscopy in the CA3 region is shown. Right, Enlarged panels of the area boxed on the left depicting vGlut1-positive large mossy fiber terminals. Circles mark vGlut1 puncta surrounded by SynCAM 1. Scale bar in overview image, 20 μm. B, Confocal images of hippocampal CA3 areas coimmunostained for presynaptic vGlut1 (red) and postsynaptic PSD-95 (green) from anatomically matched WT and KO sections at P28. Boxed areas are enlarged below, showing the green channel with PSD-95 signal. Single optical 0.8 μm sections obtained by high-resolution confocal microscopy are shown. Scale bars: overview, 20 μm; enlarged panel, 10 μm. C, Reduction of PSD-95 puncta density in KO CA3 stratum lucidum measured from images as in B. (WT, n = 3 mice with data from 4–11 sections each; KO, n = 4 mice with data from 4–11 sections each). D, DiI labeling of primary and secondary dendritic segments from hippocampal CA3 pyramidal neurons showing TEs. Anatomically matched WT and KO sections were obtained at P28. Insets show enlarged areas boxed in the overview images and arrowheads mark protruding TE spinules. Scale bars: overview, 20 μm; insets, 5 μm; apply to both panels. E, Smaller TEs in CA3 pyramidal neurons of SynCAM 1 KO mice. TE surface area on secondary dendrites from images as in D was normalized to the segment area from which they emanate (n = 3 male mice each; 2–3 neurons per mouse with 1–2 dendritic branches per neuron). F, Fewer spinules emanate from TEs in SynCAM 1 KO mice (n = 2–3 male mice each, 2–3 neurons per animal). G, Secondary dendritic segments of hippocampal CA3 neurons labeled with DiI. Anatomically matched WT and KO sections were obtained at P60. Insets show enlarged areas marked in the overview. Scale bar overview 10 μm; inset, 2 μm; apply to both panels. H, Fewer dendritic spines in CA3 pyramidal neurons lacking SynCAM 1. Analysis was performed on distal segments of secondary and also tertiary dendrites from images as in G. (3 male mice each; 2–3 neurons per animal, one dendritic branch per neuron; Student's t test).

