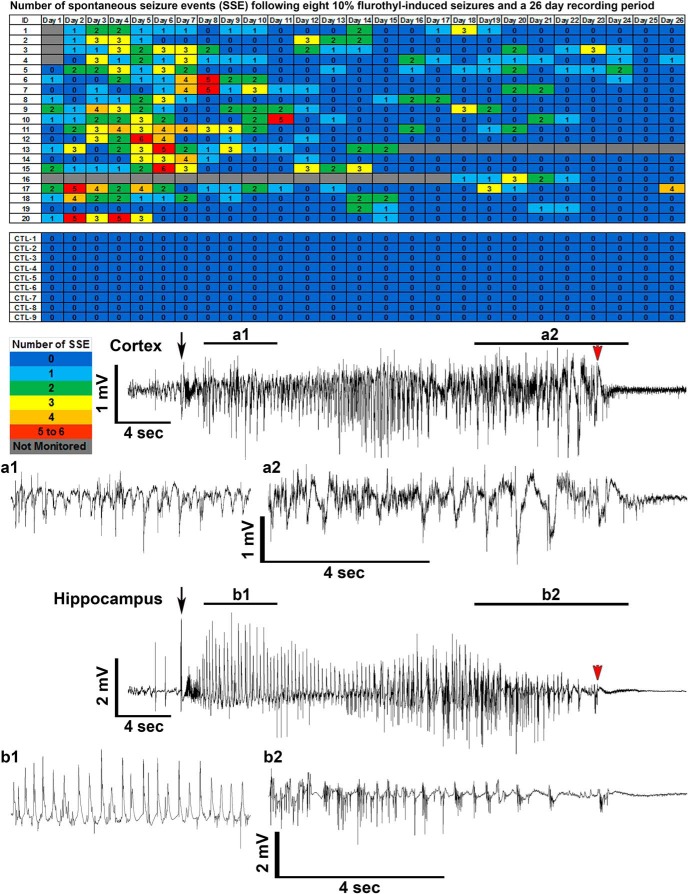
Figure 2.
Total number of spontaneous seizure episodes recorded from C57BL/6J mice exposed to eight flurothyl-induced generalized clonic seizures (flurothyl concentration, 10%). SSEs were detected in C57BL/6J mice implanted with cortical and hippocampal electrodes following eight flurothyl-induced seizures. Numbers in the first column indicate animal identifiers. Subsequent columns indicate the day during the recording period following exposure to eight flurothyl-induced seizures (day 0 is the last day of flurothyl exposure) and a 4 week recording period. Each individual box is color coded according to the legend. Each of the numbers in these boxes indicates the total number of seizures per day. C57BL/6J mice not given flurothyl-induced seizures (CTL1–9) do not express spontaneous seizures during the recording period. Also presented are low- and high-resolution representative EEGs (local field potentials) from the cerebral cortex (a1 and a2; paired low and high resolution traces) and hippocampus (b1 and b2; paired low and high resolution traces) recorded from a C57BL/6J mouse having a spontaneous generalized clonic seizure (Grade 1). Black arrows denote the beginning of the seizure, and red arrowheads indicate the end of the seizure.

