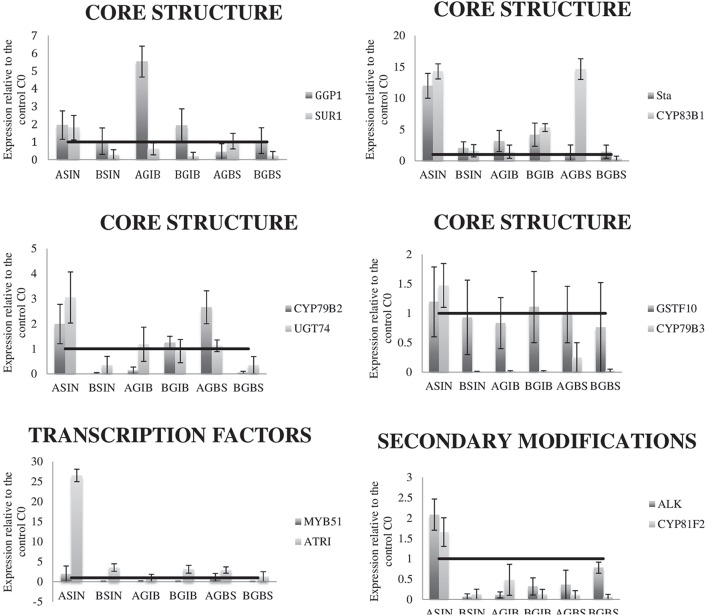
Figure 4.
Graphical representation of gene expression levels in the C3 of the three divergent selections relative to the expression of the same genes in the control (C0). Data are means of three biological replicates, and the error bars indicate their standard deviations. The horizontal line in each graph indicates the relative expression of each gene in the control. LC1, low cycle 1; LC2, low cycle 2; LC3, low cycle 3; C0, original cycle; HC1, high cycle 1; HC2, high cycle 2; HC3, high cycle 3.

