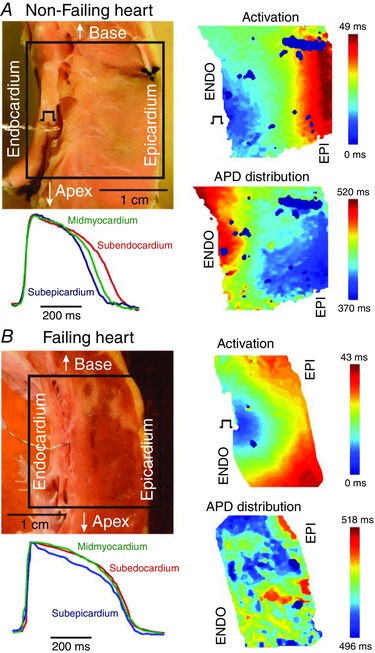
Figure 3. Optical mapping of activation and repolarization in LV wedge preparation .

Transmural activation and APD distribution contour maps from non‐failing (A) and failing (B) human hearts are shown at pacing cycle length = 2000 ms. Optical fields of view are denoted by rectangles on corresponding photos. ENDO pacing sites are also marked. Colour scales represent the activation time and APD in corresponding maps. Selected EPI, MID, and ENDO APs are superimposed and demonstrated for each heart. Adapted from Glukhov et al. (2010).
