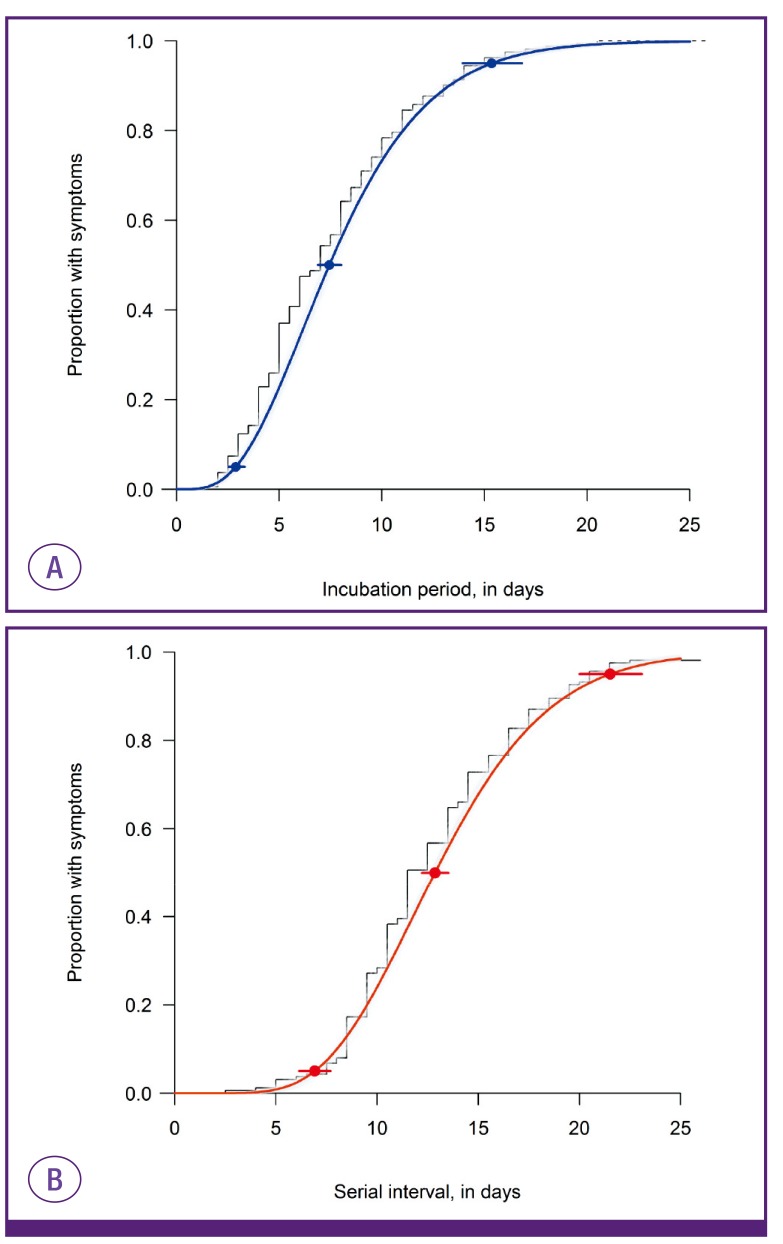
Figure 1. The distribution of incubation periods (A) and serial intervals (B) in the Middle East respiratory syndrome outbreak in Korea in 2015.
The estimation included 162 cases with a single source of exposure for incubation periods and 153 cases with identified onset of symptoms for serial intervals. The fitted distributions are plotted against the empirical cumulative density function of observed incubation periods (midpoint of exposure to symptom onset) and serial intervals (black line). The 95% confidence intervals for the 5th, 50th, and 95th percentiles of these fitted distributions are also plotted. Bootstrapped estimates are in grey shading.

