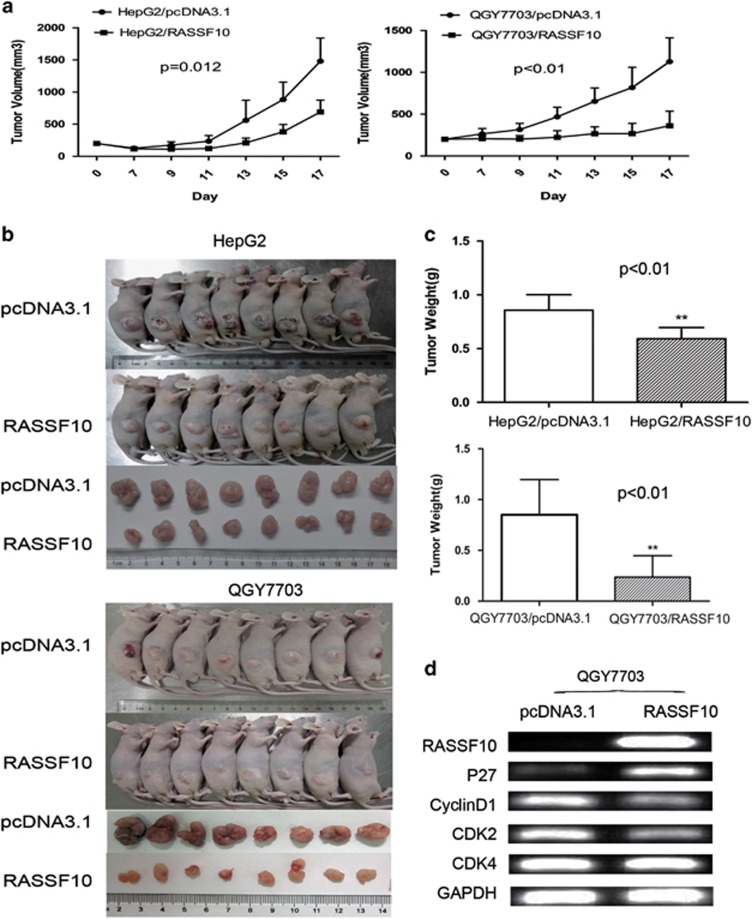
Figure 4.
RASSF10 retarded tumor growth in vivo. (a) Subcutaneous tumor growth curve of RASSF10-expressing QGY7703 and HepG2 cells in nude mice was compared with vector (pcDNA3.1) transfected cells. The RASSF10 group showed a retarded tumor growth compared with the vector group (HepG2, P=0.012; OGY7703, P<0.01). The data are means±s.d. (n=8/group). (b) A representative picture of tumor growth in nude mice subcutaneously inoculated with RASSF10 or vector (n=8/group). (c) Histogram represents mean of the tumor weight from the RASSF10 and vector groups. The asterisk indicates statistical significance (*P<0.05, **P<0.01). (d) Cell cycle mediators including p27, Cycling D1, CDK2 and CDK4 were evaluated in the xenograft tumors by RT-PCR.

