Figure 1.
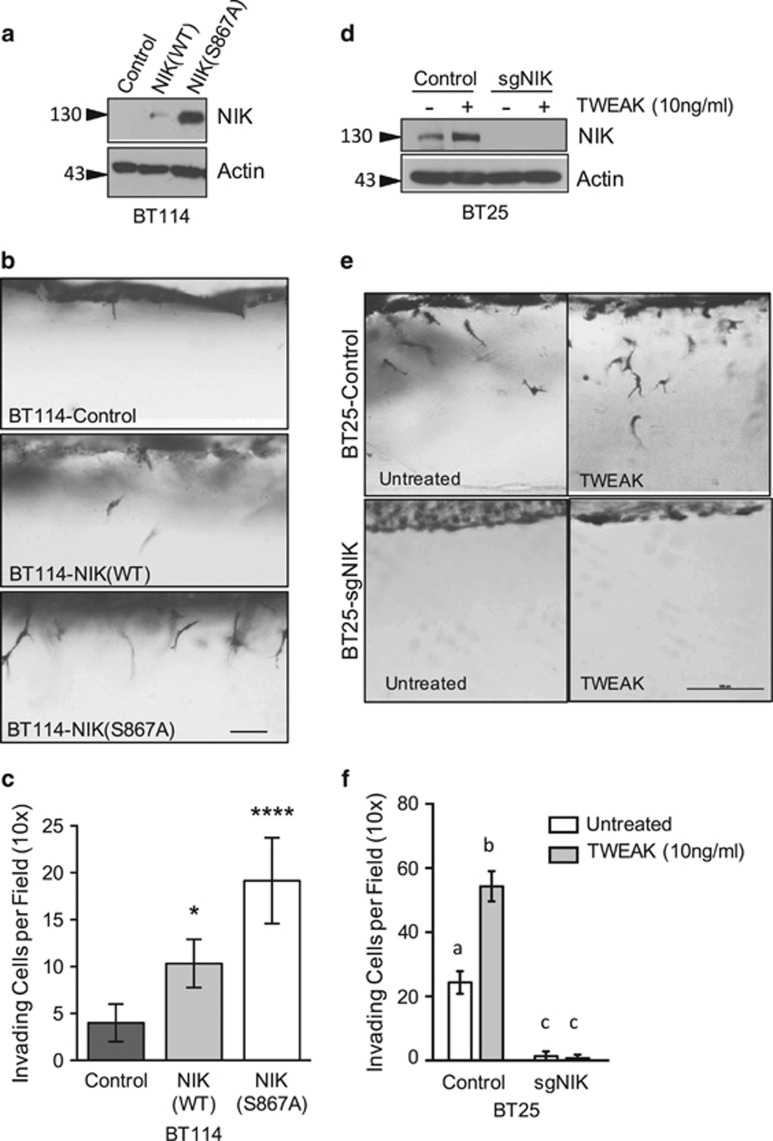
NIK promotes glioma cell invasion. (a) Western blot analysis of BT114 glioma cells transduced with lentiviral vectors expressing luciferase (Control), NIK(WT) or NIK(S867A). Whole-cell detergent lysates were probed with indicated antibodies. (b) Side view images of BT114-Control, -NIK(WT) and -NIK(S867A) cells after 24 h invasion in 3D collagen matrices. Cells in collagen matrices were fixed, stained with toluidine blue, cut into thin slices and imaged with light microscopy. Scale bar, 50 μm. (c) Quantification of invasion density of BT114-Control, -NIK(WT) and -NIK(S867A) cells in (b) represented as the average numbers of invading cells per 1-mm2 field (top-view)±s.d. after 24 h of invasion. At least six wells were quantified per experiment for four independent experiments. Graph shows mean±s.d. for a representative experiment. Statistical significance was calculated with two-way analysis of variance (ANOVA) and Tukey's HSD post test. Multiplicity-adjusted P-values: *0.0109 for Control vs NIK(WT) and ****<0.0001 for Control vs NIK(S876A). (d) Western blot analysis of whole-cell lysates from BT25-Control and clonally selected BT25-sgNIK cells. Cells were first treated with MG132 for 1 h to prevent NIK degradation and then untreated or treated with TWEAK (10 ng/ml), as indicated for 5 h. Extracts were probed with indicated antibodies. (e) Side view images of invasion assays with untreated or TWEAK-treated (10 ng/ml) BT25-Control and BT25-sgNIK cells allowed to invade 3D collagen matrices for 24 h. Scale bar=100 μm. (f) Invasion densities for (e) were quantified as described above in (c). At least three wells of invading cells were quantified per experiment for three independent experiments. Graph shows mean±s.d. from a representative experiment. Different letters represent statistically significant differences calculated with two-way ANOVA and Tukey's HSD post test. For all differences (a vs b/c, b vs a/c and c vs a/b), multiplicity-adjusted P-values are all <0.0001.

