Figure 2.
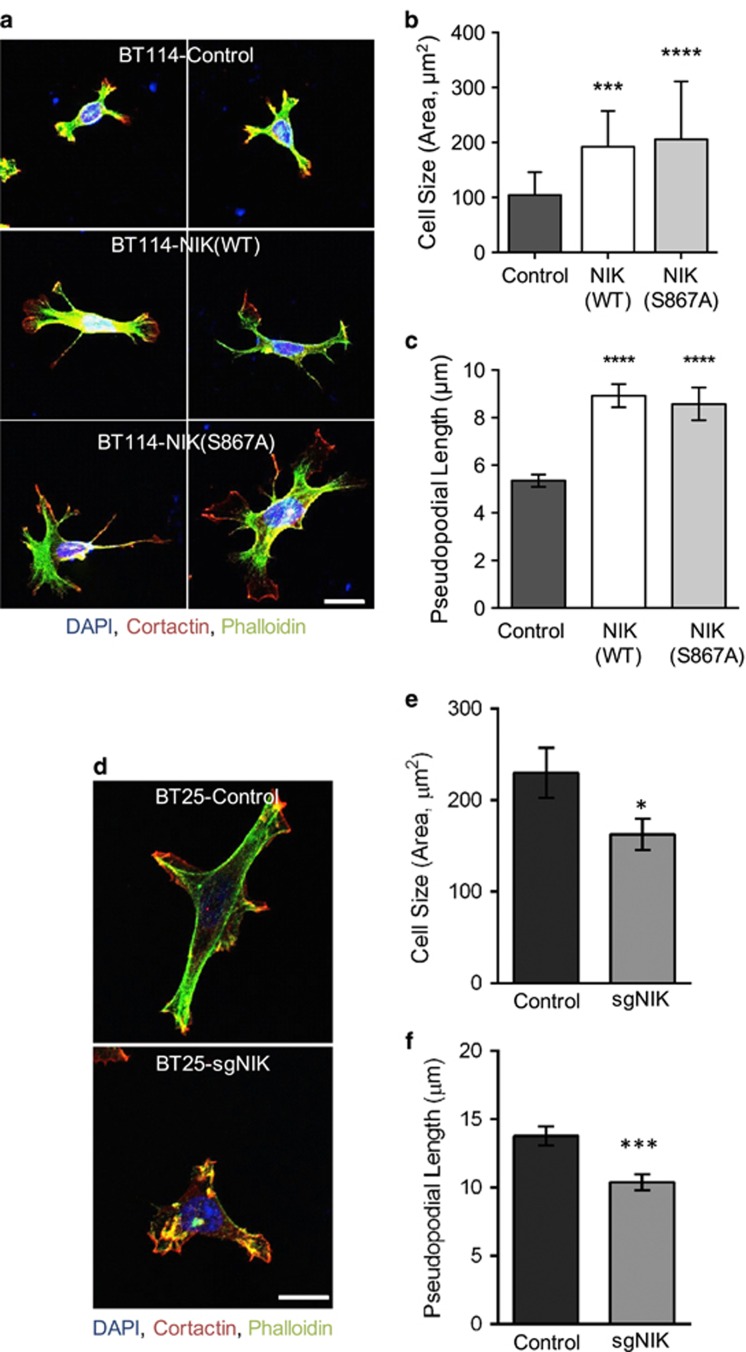
NIK enhances pseudopodia formation. (a) BT114 cells expressing Luciferase (Control), NIK(WT) or NIK(S867A) were seeded onto collagen-coated coverslips and fixed after 16 h. Cells were stained with DAPI (blue), Alexa Fluor 488-phalloidin (green) and an antibody specific for cortactin (red) and imaged using confocal microscopy. Images of representative cells are shown. Scale bar=10 μm. (b, c) Quantification of cell size and pseudopodial length of BT114 cells in (a). At least 65 cells (Control, NIK(WT) or NIK(S867A)) from three independent staining experiments were used for the following blinded quantifications: (b) average cell size (area, μm2)±s.e.m. Statistical significance was calculated with one-way analysis of variance (ANOVA) and Tukey's HSD post test. Multiplicity-adjusted P-values: ***0.0002 for Control vs NIK(WT); ****<0.0001 for Control vs NIK(S867A), (c) average length (μm) of pseudopodial structures extended from the cell body±s.e.m. Statistical significance was calculated with one-way ANOVA and Tukey's HSD post test. Multiplicity-adjusted P-values: ****<0.0001 for Control vs NIK(WT) and for Control vs NIK(S867A). (d) BT25-Control or BT25-sgNIK cells were treated and imaged as described in (a). Representative cells shown. Scale bar=10 μm. (e) Average cell size (area, μm2)±s.e.m. for BT25-Control or BT25-sgNIK cells. Unpaired t-test P-value: *0.0330 for Control vs sgNIK. (f) Average length (μm) of pseudopodial structures extended from the cell body±s.e.m. Unpaired t-test P-value: ***<0.0002 for Control vs sgNIK. At least 50 cells from three independent experiments were used for quantification (e, f).

