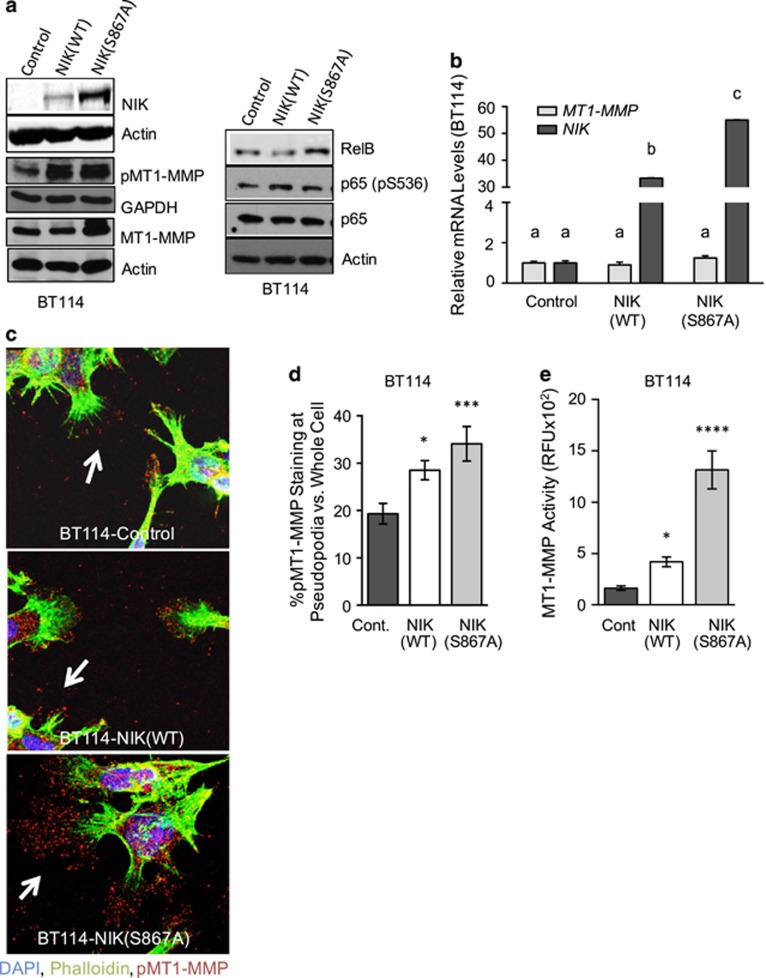
Figure 3.
NIK increases MT1-MMP activity and pseudopodial localization. (a) Representative western blot analysis (n=4) of BT114-Control, -NIK(WT) or -NIK(S867A) cells. Whole-cell lysates were probed with indicated antibodies. (b) qPCR analysis was performed to analyze expression of MT1-MMP and NIK in BT114 cells expressing Control, NIK(WT) or NIK(S867A). Graph shows fold-change MT1-MMP and NIK expression relative to BT114-Control cells. Average gene expression was calculated from triplicate wells from a representative experiment that was repeated three times. GAPDH expression was used as the endogenous control. Statistical analysis of gene expression data was calculated using two-way analysis of variance (ANOVA) with Tukey's HSD post test. Different letters indicate statistically significant differences with multiplicity-adjusted P-values<0.0001 for all comparisons. (c) BT114 cells expressing Control, NIK(WT) or NIK(S867A) grown on collagen-coated coverslips were stained with DAPI (blue), Alexa Fluor 488-phalloidin (green) and anti-pMT1-MMP (Y573) (red). Confocal microscopy was used to evaluate subcellular localization of pMT1-MMP. Images of representative cells from one of six experiments are shown. Arrows indicate pMT1-MMP localized to pseudopodia. (d) Quantification of pMT1-MMP staining that localized to pseudopodia was performed using images obtained in (c) and normalized to total cellular pMT1-MMP staining: at least 30 cells from six different experiments were used for quantification. One-way ANOVA with Tukey's HSD post test multiplicity-adjusted P-values: *0.0394 Control vs NIK(WT); ***0.0009 Control vs NIK(S867A). (e) MT1-MMP activity was assayed in the indicated cells after 16 h of invasion using the Sensolyte 520-MMP14 Assay kit (AnaSpec) with modifications to specifically quantify MT1-MMP activity.54 Representative graph from three experiments depicts average RFU (relative fluorescence units)±s.d. One-way ANOVA with Holm-Sidak post test multiplicity-adjusted P-values: *0.0301 for NIK(WT) vs Control; ****<0.0001 for NIK(S867A) vs Control.

