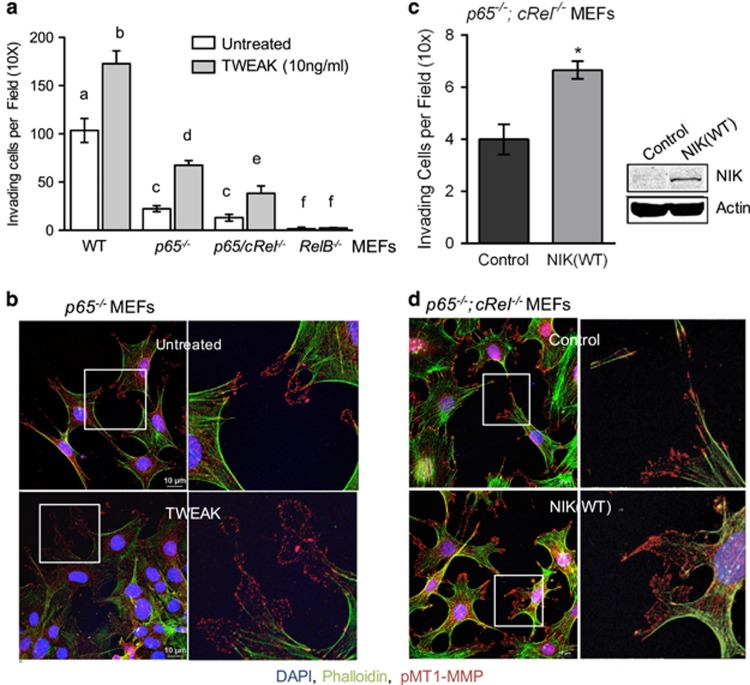
Figure 5.
TWEAK increases invasion and pMT1-MMP pseudopodia localization in the absence of canonical NF-κB p65/cRel proteins. (a) WT MEFs and NF-κB-null MEFs were allowed to invade collagen matrices±10 ng/ml TWEAK. WT represents pooled invasion data from p65+/+, p65/cRel+/+ and RelB+/+ MEFs with a total of n=9 per treatment (±TWEAK). Three independent experiments were performed counting three invading wells per treatment. Graph depicts one representative experiment. Differences between untreated and TWEAK-treated samples of a given genotype, as well as differences among untreated or TWEAK-treated cells of different genotypes were analyzed using two-way analysis of variance (ANOVA) with Tukey's HSD post test. Statistically significant differences are indicated by different letters. Multiplicity-adjusted P-values: ****<0.0001 between all letters, except ***<0.001 for ‘c vs e' and *<0.01 for ‘c vs f.' (b) p65−/− MEFs were seeded onto collagen-coated coverslips and treated with or without (untreated) 10 ng/ml TWEAK for 4 h. Cells were fixed and stained with anti-pMT1-MMP (red), Alexa Fluor 488-phalloidin (green) and DAPI (blue), and imaged using confocal microscopy. Scale bar=10 μm. Right panels show the zoomed portion of the boxed image on the left. Images of representative cells from one of three experiments are shown. (c) Invasion density of p65−/−;cRel−/− knockout MEFs transduced to express vector (Control) or NIK(WT). At least four wells were quantified per treatment for three independent experiments. Graph depicts one representative experiment. Unpaired t-test P-value: *0.01. Panel shows western blot analysis of p65−/−; cRel−/− knockout MEFs expressing vector (Control) or NIK(WT) confirming exogenous NIK expression. (d) p65−/−; cRel−/−MEFs were seeded onto collagen-coated coverslips, and treated and immunostained as described in (b). Scale bar, 10 μm.

