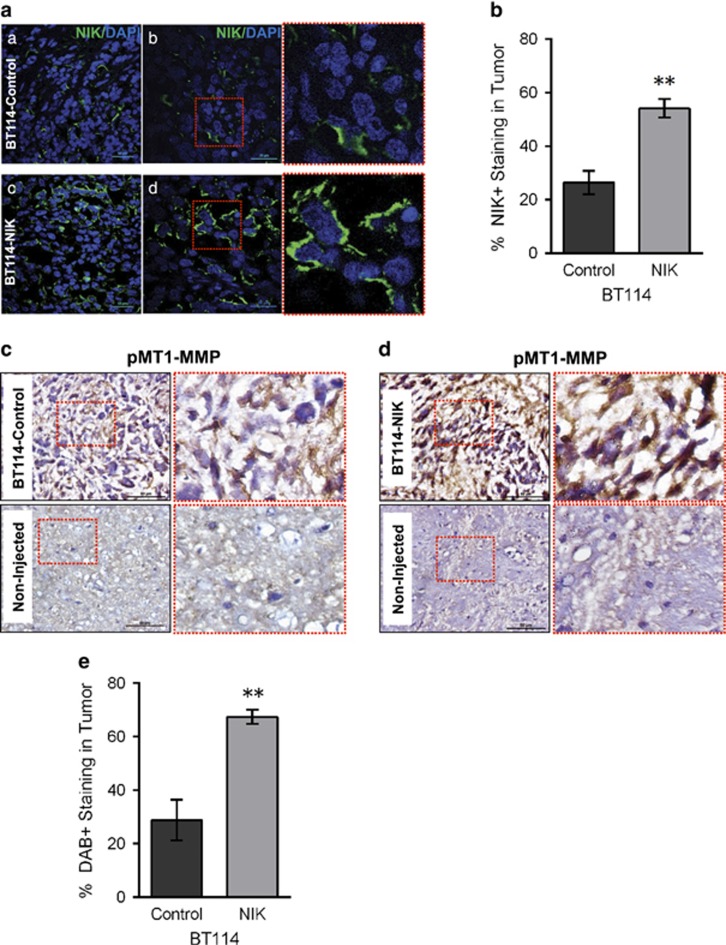
Figure 6.
NIK increases tumor growth and pMT1-MMP in vivo. (a) Sections from BT114-Control or BT114-NIK xenograft tumors3 were stained with DAPI (blue) and anti-NIK (green), and imaged using confocal microscopy. Representative images from at least three independent tumors from each group are shown. Scale bars, 20 μm (panels a, c) and 50 μm (panels b, d). Red boxes on sections from b and d are shown magnified on the right. (b) Graph shows percent NIK expression in tumors quantified from five sections of each tumor using Image J software analysis. Data are reported as mean±s.e.m. **P=0.0011 vs BT114-Control using unpaired Student's t-test. (c, d) Immunohistochemical diaminobenzidine (DAB) staining (brown) of sections from BT114-Control (c) or BT114-NIK (d) tumors with anti-pMT1-MMP (Y573) antibody. The portion of the image marked with a red dotted square is shown as a zoomed image on the right. Sections from non-injected brain region are shown as a negative control. Scale bar=50 μm. (e) Graph shows quantification of pMT1-MMP staining (c, d) from five sections of tumors derived from BT114-Control or BT114-NIK cells using IHC profiler59 to measure positive pixel counts for DAB staining; data are reported as mean±s.e.m **P=0.0014 vs BT114-Control using unpaired Student's t-test.

