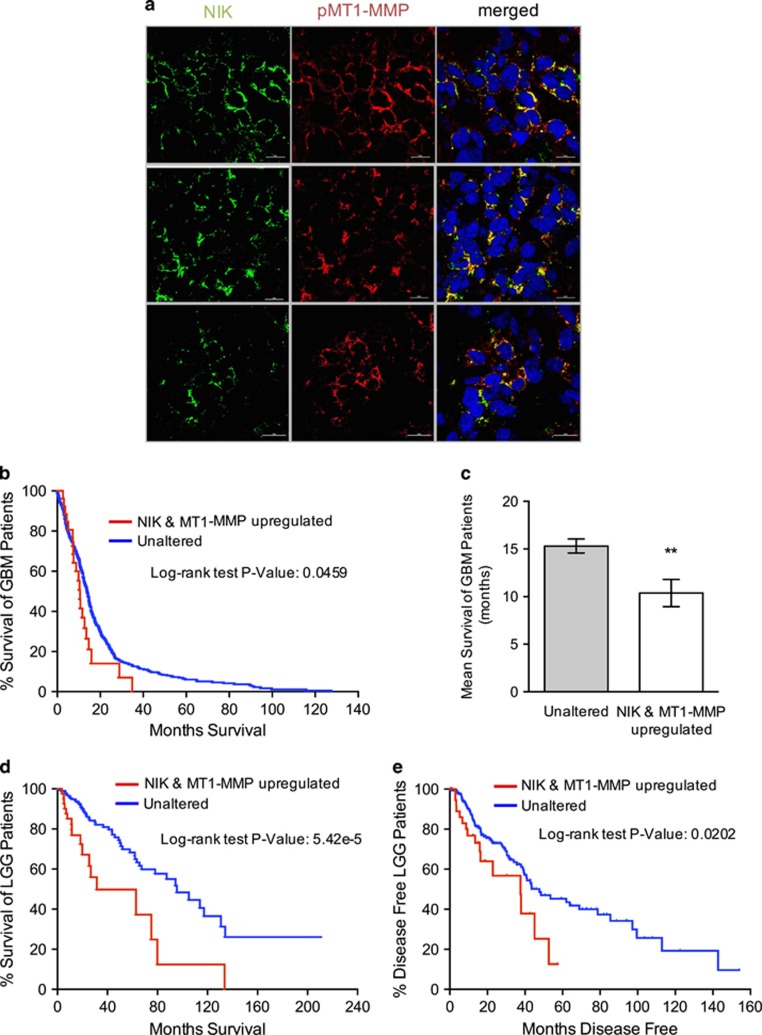
Figure 7.
NIK and MT1-MMP are co-expressed in human glioma and correlate with poor patient survival. (a) Sections of human glioma ex vivo tissue were stained with antibodies specific for pMT1-MMP (Y573) (red) and NIK (pre-conjugated with AF488; green). Representative images are shown from three tumors. (b) Kaplan–Meier curve representing TCGA patient survival data from GBM patients with upregulated NIK (MAP3K14) and MT1-MMP (MMP14) mRNA expression. Data were downloaded from cBioPortal for Cancer Genomics TGCA, Cell 2013 data set.57 Log-rank Mantel-Cox test indicates statistical significance with P=0.0459. (c) Mean survival (months) of GBM patients with unaltered (n=509) or upregulated NIK and MT1-MMP expression (n=27). Unpaired Welch t-test indicates statistical significance with **P=0.0038. (d) Kaplan–Meier curve representing TCGA patient survival data from LGG patients with upregulated NIK and MT1-MMP mRNA expression (LGG provisional raw data at the NCI). Log-rank Mantel-Cox test indicates statistical significance with P=5.42e−5. (e) Kaplan–Meier curve representing disease-free time for LGG patients with upregulated NIK and MT1-MMP. Log-rank Mantel-Cox test indicates statistical significance with P=0.0202.

