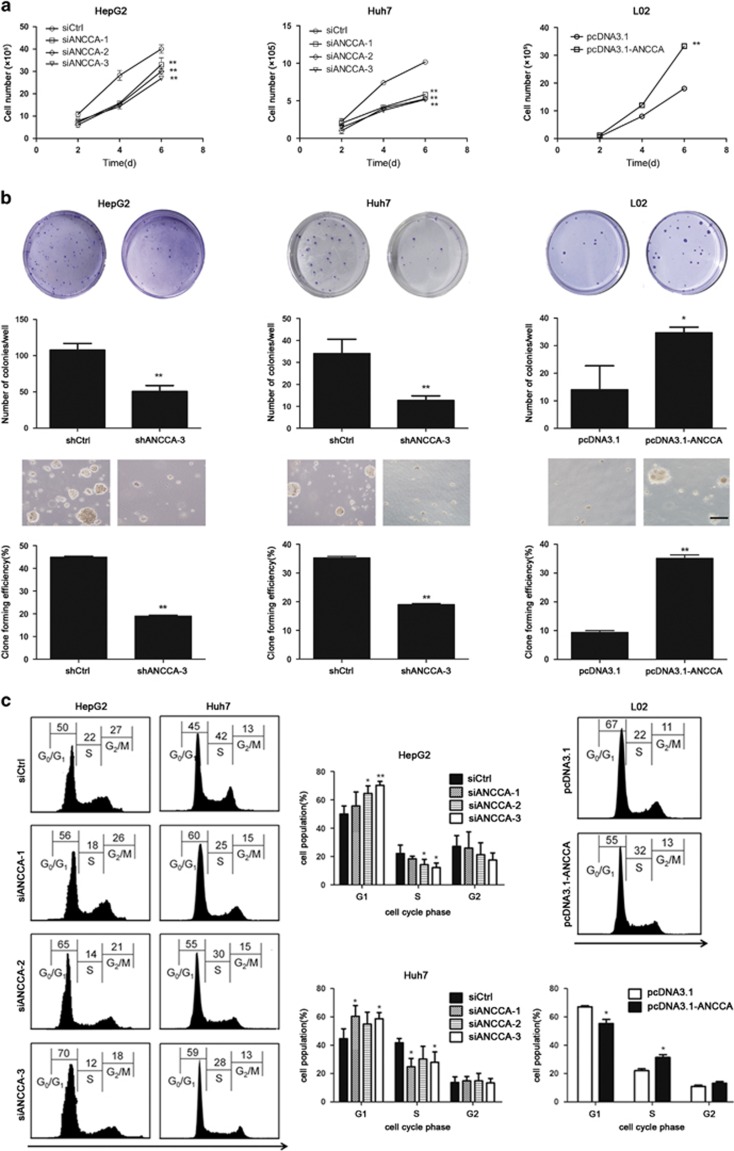
Figure 3.
ANCCA/PRO2000 affected cell proliferation in vitro by interfering with cell cycle progression. (a) Proliferation assays of HepG2, Huh7 and L02 cells with altered ANCCA/PRO2000 expression. Each sample was assayed in triplicates for 6 consecutive days. (b) Plate clone-forming (upper) and soft-agar colony (lower) assays of HepG2, Huh7 and L02 cells. Representative photographs are shown, and the numbers of colonies were counted. Scale bar, 100 μm. (c) FACS analysis of distribution of cells in each cell cycle phase. Representative FACS profiles were shown, on which numbers indicate percentage of cells in G0/G1, S or G2/M phase. Error bars indicate mean±s.d. from three independent experiments. *P<0.05; **P<0.01. P-values were determined using independent samples T-test.

