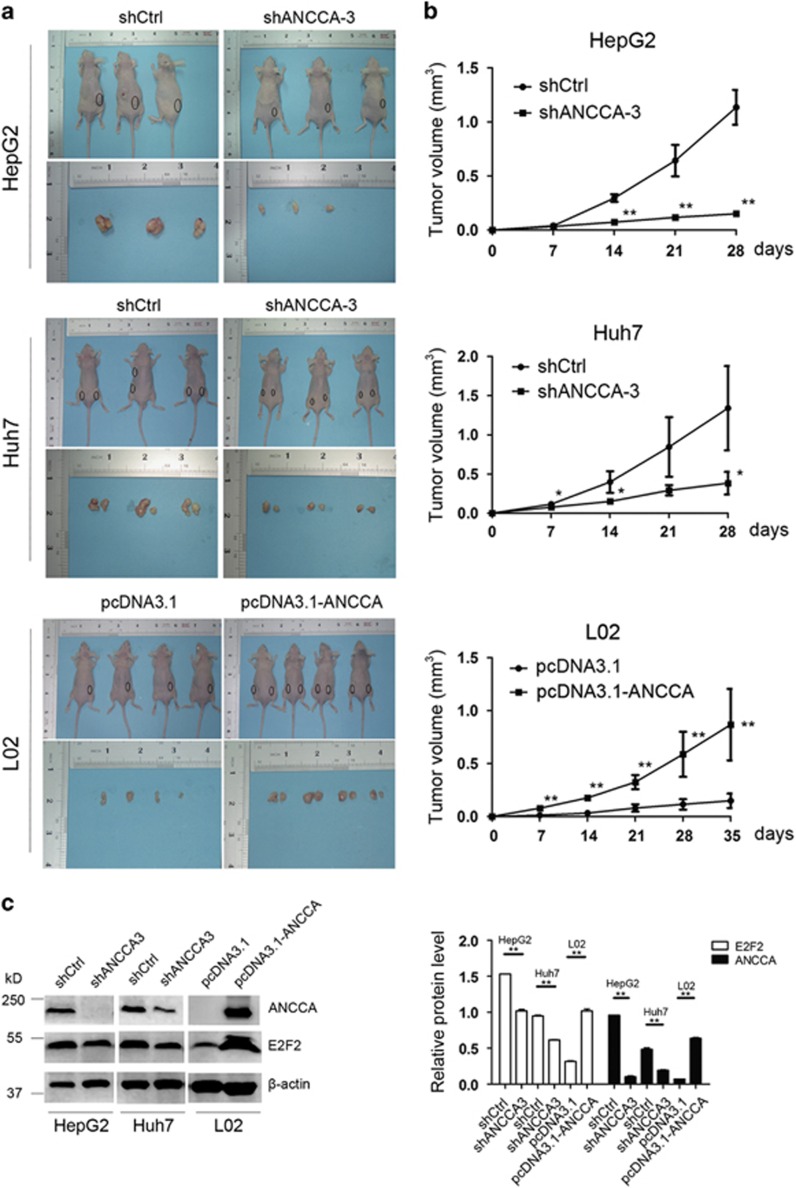
Figure 5.
ANCCA/PRO2000 enhanced tumorigenicity of HCC cells in nude mice. (a) Tumors formation of cells stably with either high or low ANCCA/PRO2000 expression (N=3 or 4 mice for each group). (b) Growth curve of tumor volumes. (c) Western blotting analysis of ANCCA/PRO2000 and E2F2 protein expressions in tumor xenografts. The error bars represent mean±s.d. *P<0.05; **P<0.01, versus shCtrl or pcDNA3.1.

