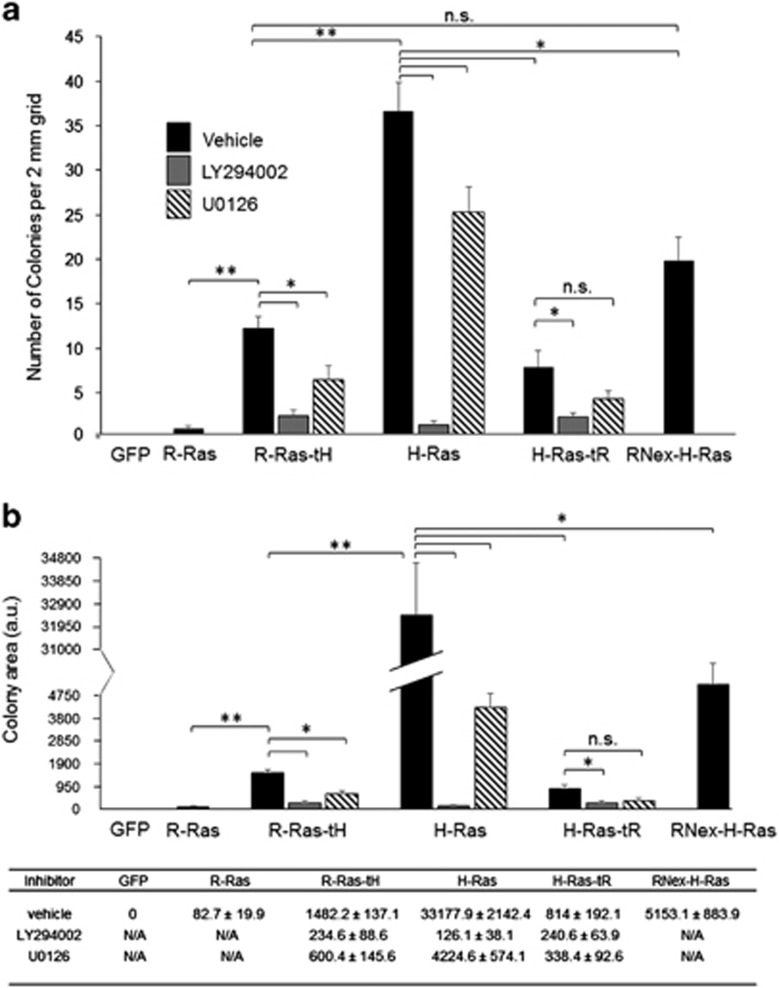
Figure 4.
The H-Ras tD modulates Ras-induced cell transformation. 5 × 10⁴ cells were seeded into 0.3% agar for 14 days, and cells were fixed and imaged. (a) Number of colonies per 2 mm grid are shown. (b) Area of colonies per 2 mm grid were measured using ImageJ software. Average total areas per grid are shown+s.e.m. *P<0.001; **P<2 × 10⁻⁶. n.s., not significant. n=6. The values for the histogram in (b) are shown below in tabular form, ±s.e.m.

