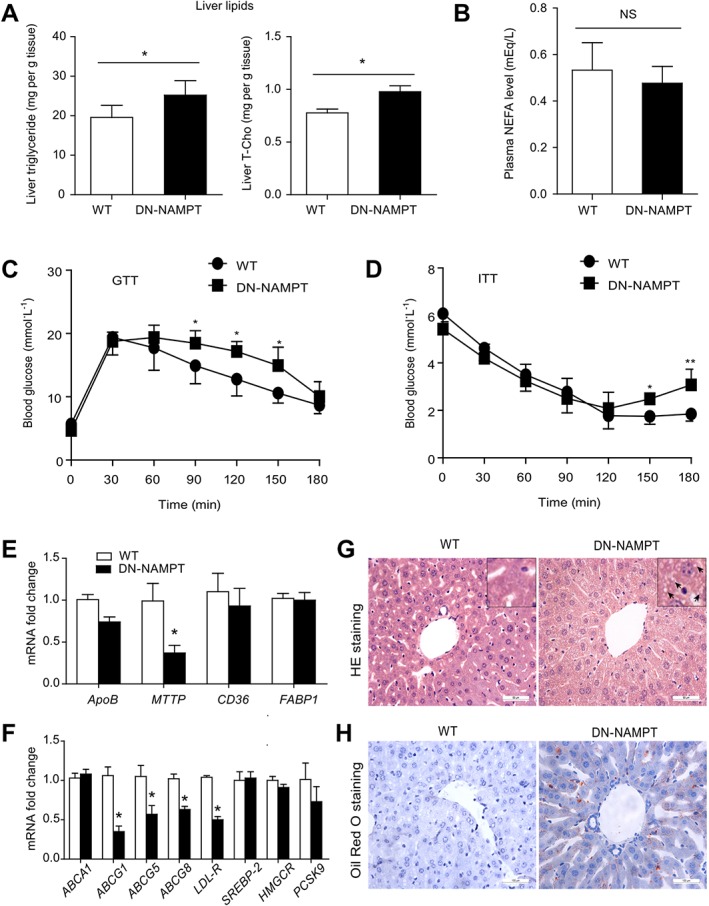
Figure 2.

Impaired systemic lipid homeostasis and moderate hepatic steatosis in DN‐NAMPT mice given normal chow. (A) The levels of triglyceride and total‐cholesterol in liver tissue of WT and DN‐NAMPT mice. *P < 0.05. n = 8 for each group. (B) Plasma NEFA levels of WT and DN‐NAMPT mice. (C and D) GTT and ITT showing insulin resistance in DN‐NAMPT mice. *P < 0.05. n = 8 for each group. (E and F) Relative mRNA levels of the genes regulating transport of triglyceride (E) and cholesterol (F) in liver tissues of WT and DN‐NAMPT mice. *P < 0.05. n = 8 for each group. (G) Representative images for H&E staining of liver tissues of WT and DN‐NAMPT mice. (H) Representative images for Oil Red O staining of liver tissues of WT and DN‐NAMPT mice.
