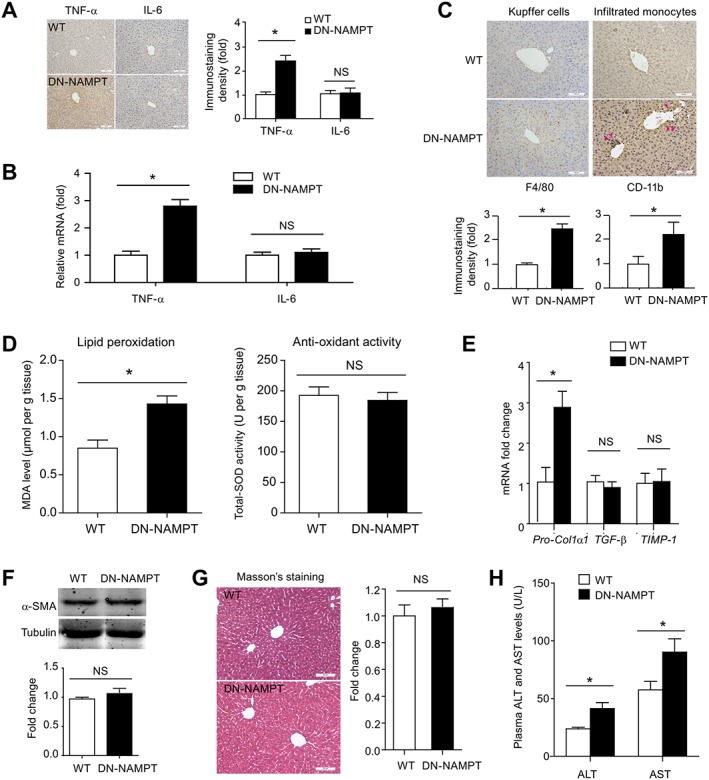
Figure 3.

Hepatic inflammation and injury in DN‐NAMPT mice given normal chow. Immunohistochemistry (A) and real‐time PCR (B) analyses of the pro‐inflammatory factors TNF‐α and IL‐6 in liver tissues of WT and DN‐NAMPT mice. *P < 0.05. n = 8 for each group. Scale bar, 100 μM. (C) Representative images and quantitative analysis of Kupffer cell numbers and infiltrated monocytes by F4/80 (left panel) and CD‐11b (right panel) immunohistochemistry staining in liver tissues of WT and DN‐NAMPT mice. *P < 0.05. n = 8 for each group. Scale bar, 100 μM. (D) Lipid peroxidation and antioxidant activity were evaluated by MDA level and total SOD activity respectively. *P < 0.05. n = 8 for each group. (E) The mRNA levels of Pro‐Col1α1, TGF‐β and TIMP‐1 in WT and DN‐NAMPT mice livers. *P < 0.05. NS, no significance. n = 8 for each group. (F) The protein level of α‐SMA in WT and DN‐NAMPT mice livers. NS, no significance. n = 8 for each group. (G) Masson's staining in WT and DN‐NAMPT mice livers. NS, no significance. n = 8 for each group. (H) Plasma ALT and AST levels of WT and DN‐NAMPT mice. *P < 0.05. n = 8 for each group.
