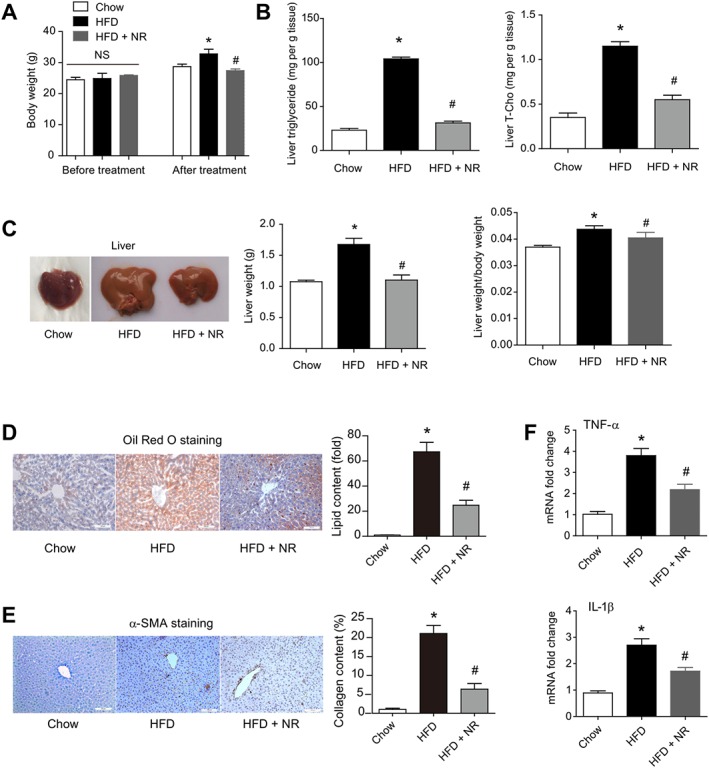
Figure 7.

Dietary supplementation with NR corrects HFD‐induced hepatic steatosis in WT mice. (A) Changes of body weight in WT mice fed chow, HFD and HFD + NR. *P < 0.05. n = 8 for each group. HFD was fed for 16 weeks and NR was administrated for 4 weeks. *P < 0.05 versus chow, # P < 0.05 versus HFD by ANOVA analysis. n = 8 for each group. (B) Lipid triglyceride and cholesterol levels in livers of mice fed chow, HFD and HFD + NR. T‐Cho, total cholesterol. *P < 0.05 versus chow, # P < 0.05 versus HFD by ANOVA analysis. n = 8 for each group. (C) Representative images of liver, liver weight and liver weight/body weight ratio in mice fed HFD or HFD plus NR. *P < 0.05 versus chow, # P < 0.05 versus HFD by ANOVA analysis. n = 8 for each group. Oil Red O staining (D) and immunohistochemistry staining of α‐SMA (E) in livers of mice fed chow, HFD and HFD + NR. *P < 0.05 versus chow, # P < 0.05 versus HFD by ANOVA analysis. n = 8 for each group. (F) Pro‐inflammatory factors production in livers of mice fed chow, HFD and HFD + NR. *P < 0.05 versus chow, # P < 0.05 versus HFD by ANOVA analysis. n = 8 for each group.
