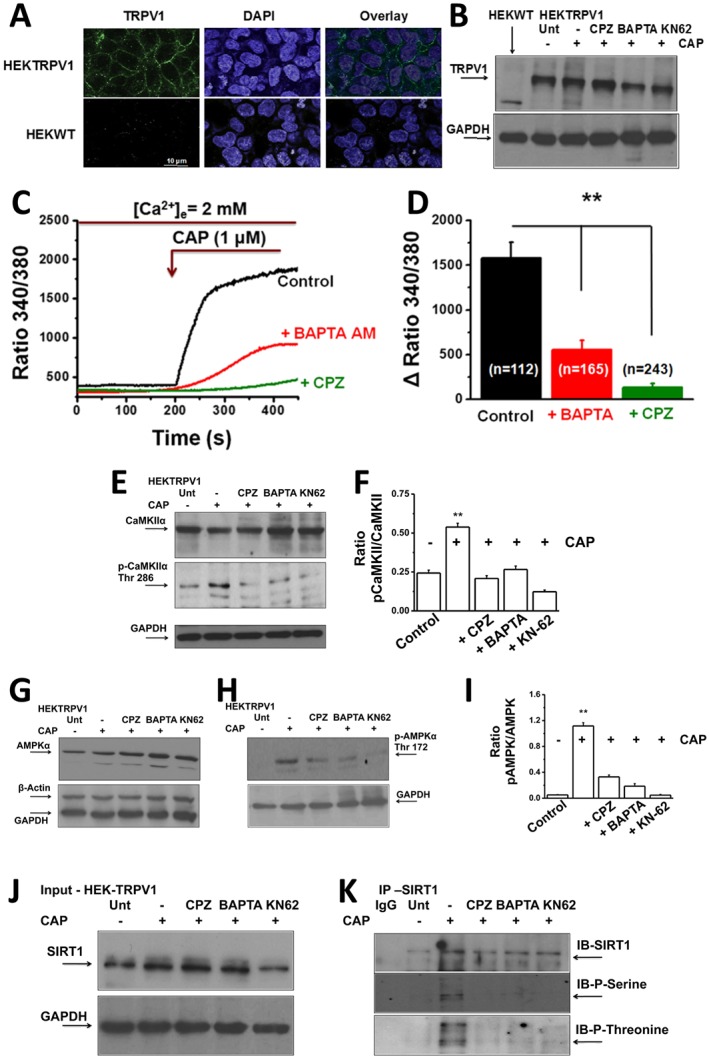
Figure 9.

Intracellular Ca2 + chelation by BAPTA‐AM or pretreatment with capsazepine (CPZ; TRPV1 antagonist) suppresses CAP‐stimulated Ca2 + influx in HEKTRPV1 cells. (A) Left panel: TRPV1 immunoreactivity in HEKTRPV1 (top) and WT HEK293 (HEKWT) cells (n = 6). Middle and right panels represent DAPI staining and overlay respectively. (B) Western blot showing the expression of TRPV1 channel protein in HEKWT and HEKTRPV1 cells. Expression of TRPV1 channels in untreated cells, + capsaicin (CAP)‐treated cells (1 μM; 30 min) + capsazepine (CPZ)‐treated cells (10 μM; 60 min) + 1 μM CAP‐treated cells (30 min), 10 μM BAPTA‐AM‐treated cells (intracellular Ca2 + chelator; 60 min) + 1 μM CAP‐treated cells or 5 μM KN62‐treated cells (CaMKII inhibitor; 60 min) + 1 μM CAP‐treated cells. Cells were then lysed and probed for TRPV1 expression (n = 5 independent experiments). (C) Representative traces showing the time courses of basal and 1 μM capsaicin‐stimulated Ca2 + influx in HEKTRPV1 cell. These cells were pretreated with CPZ or BAPTA‐AM for 60 min prior to experiments. Cells were perfused with 2 mM Ca2 +‐containing extracellular solution, and 1 μM CAP was added as indicated by arrow in the figure. (D) Bar graphs represent average change ± SEM of Fura‐2 fluorescence following 1 μM CAP stimulation in HEKTRPV1 cells pretreated with vehicle, CPZ or BAPTA‐AM. Figures in parentheses represent the number of vehicle, CPZ‐treated cells or BAPTA‐AM‐treated cells. ** represent statistical significance for P < 0.05. (E), (G) and (H) CaMKIIα/pCaMKIIα (Thr286) and AMPKα/pAMPKα (Thr172) expression in untreated cells (Unt; no CAP; vehicle alone; lane 1), CAP‐treated cells (1 μM; 30 min; lane 2), CPZ‐treated cells (10 μM; lane 3), BAPTA‐AM‐treated cells (10 μM; lane 4) or KN62‐treated (5 μM; lane 5) HEKTRPV1 cells (GAPDH, loading control). (F) and (I) Mean ± SEM of ratio of intensities pCaMKIIα to total‐CaMKIIα and pAMPKα to total AMPKα. (J) Immunoblotting of total SIRT‐1 (10% input) in untreated, CAP‐treated, CPZ‐treated, BAPTA‐AM‐treated or KN62‐treated HEKTRPV1 cells (GAPDH, loading control). (K) Representative Western blot showing SIRT‐1 phosphorylation (using phosphoserine antibody) in the immunoprecipitated samples.
