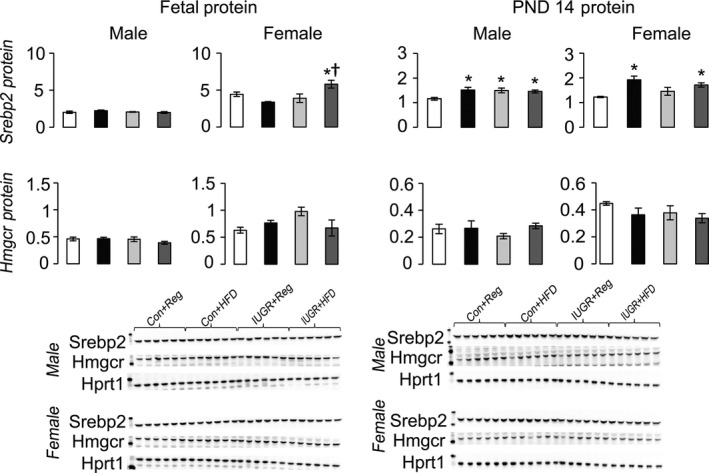
Figure 7.

Protein levels of proteins involved in hepatic de novo cholesterol synthesis relative to control protein Hprt1. *P ≤ 0.05 compared to sex‐matched Con+Reg, †P ≤ 0.05 compared to sex‐matched Con+HFD. Data from Con+Reg rats are shown in white bars, Con+HFD rats are shown in black bars, IUGR+Reg rats shown in light gray bars, and IUGR+HFD rats are shown in dark gray bars. Western blot image is depicted below the graph, with a representative Hprt1 control blot at the bottom. N = 6 per sex, diet, and surgical intervention. Data are shown as mean ± SEM. HFD, high‐saturated‐fat diet; IUGR, Intrauterine growth restriction.
