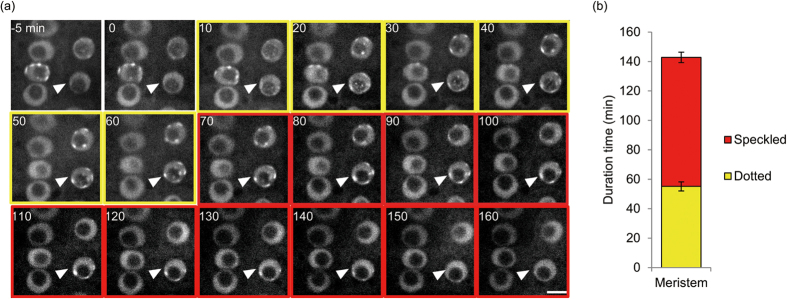
Figure 3. Live imaging of AtPCNA1-EGFP through the cell-cycle progression.
(a) Images taken at 5 min intervals in the meristematic zone of a root expressing AtPCNA1-EGFP. The pattern of AtPCNA1 signals changed sequentially from whole to dotted, speckled and whole through the cell-cycle progression. The numbers indicate duration from time 0 in minutes. The yellow and red outer frames indicate that signals in the nucleus indicated by a white arrowhead exhibit dotted and speckled patterns, respectively. Bar = 5 μm. (b) Duration of dotted and speckled patterns of AtPCNA1-EGFP signals (n = 7 for dotted pattern, n = 8 for speckled pattern). Error bars denote the SE.

