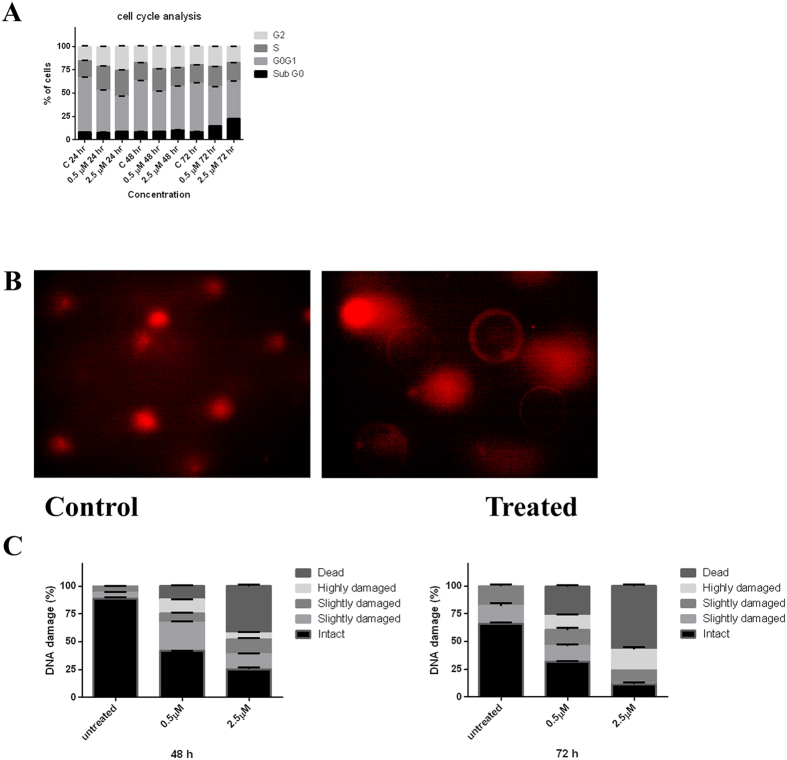
Figure 4. Cell cycle analysis and genotoxicity assessment.
(A) Cell-cycle analysis of hydra exposed to various concentrations of CuO NR at different time points. The DNA content was determined using flow cytometry by staining with propidium iodide and the post-analysis was done with FlowJo software based on Watson (Pragmatic) model. Data are expressed as mean ± SE of three independent experiments. (B) Representative image of DNA damage in normal and CuO NR-exposed hydras as assessed by comet assay. (C) DNA damage is classified based on DNA in the tail. The stacked column (from bottom to top) corresponds to intact (0–20%), slightly damaged (20–40%), damaged (40–60%), highly damaged (60–80%), and dead (80–100%). Data are expressed as mean ± SE of three independent experiments.

