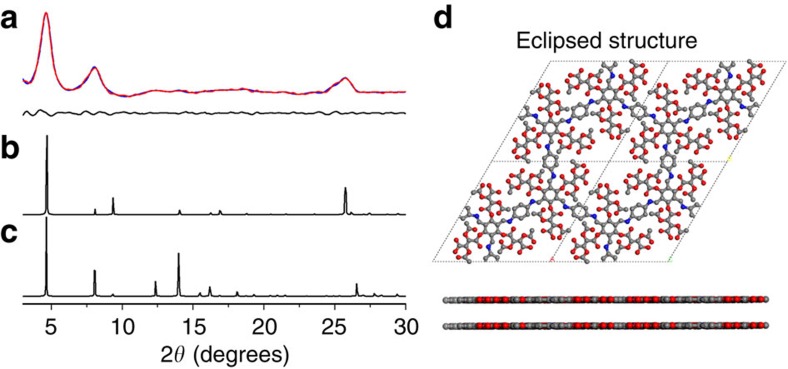
Figure 2. PXRD patterns and the structure of CTpPa-1.
(a) Experimental PXRD pattern of CTpPa-1 (red curve), refined modelling PXRD pattern of CTpPa-1 (blue curve) and the difference plot of the two PXRD patterns (black curve). (b) Simulated PXRD pattern of CTpPa-1 for the eclipsed model. (c) Simulated PXRD pattern of CTpPa-1 for the staggered model. (d) Eclipsed structure of CTpPa-1. C, grey; N, blue; O, red; H is omitted for clarity.

