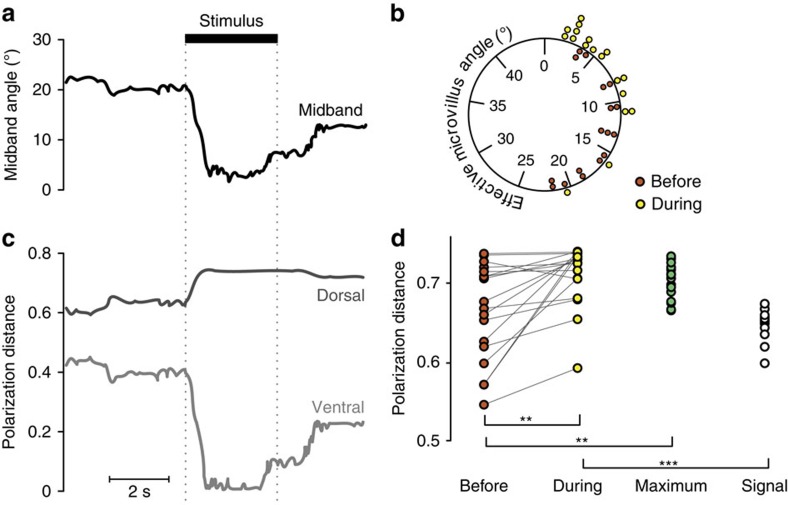
Figure 4. Experimental results where six O. scyllarus were presented with expanding circular looming stimuli displayed on an LCD monitor.
Captions as for the LED experiment. Note that the angle measured in b is between the optimal receptor alignment for detecting the maximum polarization contrast, and the nearest set of polarization receptors. (d) Same data as b, with paired comparison between the calculated PD, both before (red circles), and during (yellow circles) the stimulus presentation and compared with a set of bootstrap resampled maximum data points (green circles). In addition, the modelled data set representing the viewed PD if the closest group of microvilli were aligned with the stimulus angle of polarization (open circles) is shown. Stars represent levels of statistical significance: *P<0.05; **P<0.01; ***P<0.001.

