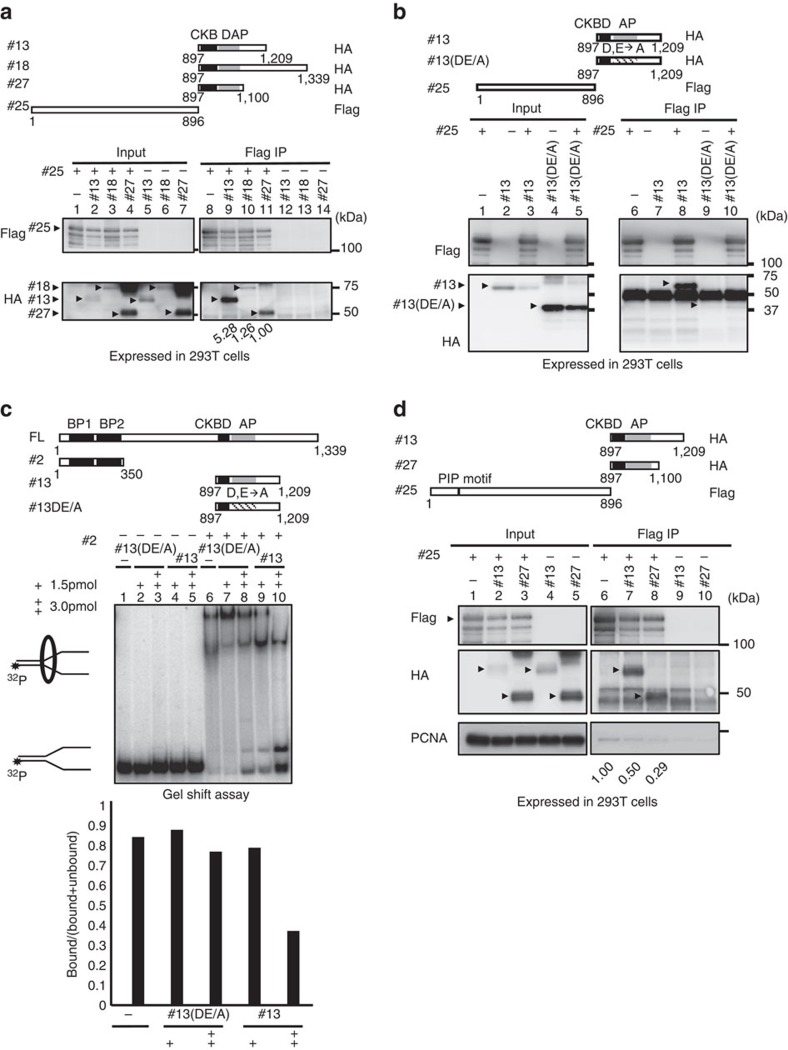
Figure 6. The C-terminal acidic patch interacts with the N-terminal segments of Claspin and inhibits its binding to DNA or PCNA.
(a) Upper drawing, a schematic diagram of the Claspin polypeptides expressed and their attached tags. Lower, the Flag-tagged N-terminal segment (#25) was coexpressed with the HA-tagged C-terminal polypeptides and pulled down with M2 Flag beads. The inputs and immunoprecipitates (Flag IP) were analysed by western blotting using anti-Flag or anti-HA antibody. Values under the right panel are the amount of the C-terminal polypeptides in Flag IP relative to the input proteins and those for #27 are taken as 1.00. (b) The Flag-tagged N-terminal segment (#25) was coexpressed with the wild-type or DE/A mutant C-terminal polypeptide #13 and pulled down with M2 Flag beads, and the inputs and the immunopreipitates (Flag IP) were analysed by western blotting using anti-Flag or anti-HA antibody. Arrowheads indicate the wild-type and DE/A #13 polypeptides. Note that the wild-type #13 polypeptide migrates anomalously on PAGE due to the presence of acidic residues. (c) The C-terminal acidic patch polypeptide (#13; 1.5 and 3 pmol) or C-terminal DE/A mutant (#13 DE/A; 1.5 and 3 pmol) was added to the gel shift reaction containing labelled Y-fork (20 fmol) and the N-terminal polypeptide #25 (1.5 pmol). The graph shows the quantification of the binding by calculating the ratio of bound radioactivity to the total radioactivity (bound+unbound). (d) The Flag-tagged N-terminal segment (#25) was coexpressed with the HA-tagged C-terminal polypeptides. The inputs and immunoprecipitates (Flag IP) with M2 Flag bead were analysed by western blotting for #25 and associated PCNA. Arrowheads indicate the expressed proteins. Values under lanes 6, 7 and 8 represent relative intensities of the coimmunoprecipitated PCNA bands. Grey box indicate AP and striped box indicate the DE/A mutant AP.

