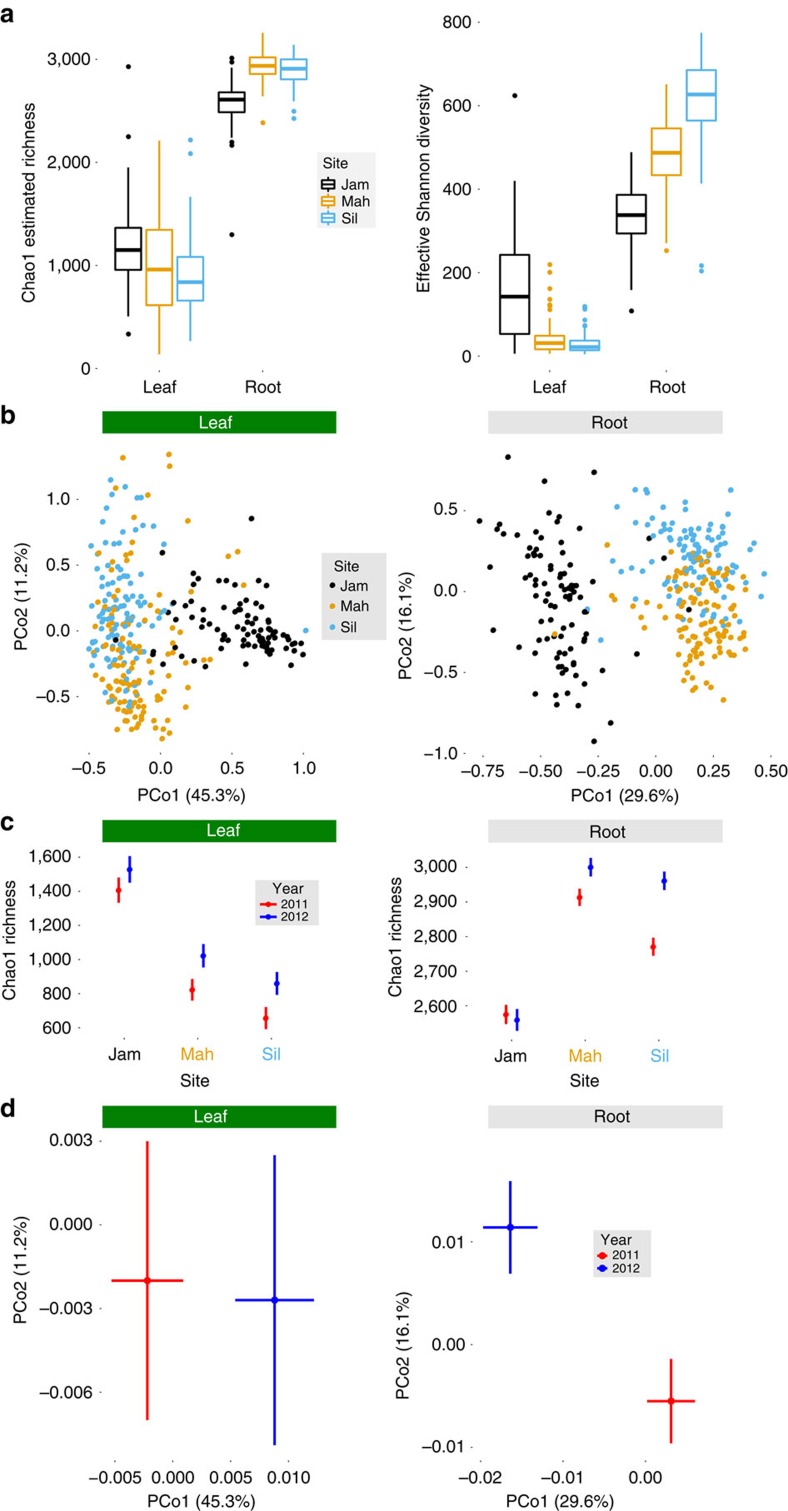
Figure 2. Habitats differ strongly in richness and composition of leaf- and root-associated bacterial communities.
Sample sizes are N=306 for leaves and N=310 for roots. (a) Mean Chao1 richness and effective Shannon diversity (eShannon entropy) differed among field sites for both roots and leaves (ANOVA, P<1.5e−11; detailed statistics are found in Table 1). The bottom and top edges of the boxes mark the 25th and 75th percentiles (that is, first and third quartiles). The horizontal line within the box denotes the median. Whiskers mark the range of the data excluding outliers that fell more than 1.5 times the interquartile range below the first quartile or above the third quartile (dots). (b) PCoA of weighted UniFrac distances reveals that field site is a major source of bacterial community variation in both leaves and roots (ANOVA, P<9e−7; detailed statistics in Table 2). Similar patterns result from PCoA of unweighted UniFrac distances, which only considers presence/absence of OTUs (Supplementary Fig. 4). (c) α-Diversity increased between 2011 and 2012 at most sites (ANOVA, P<0.05; detailed statistics in Table 1). Least-squares mean Chao1 richness is plotted for each year and each site; error bars represent 1 s.e.m. (d) Microbiome composition changed moderately between 2011 and 2012 (ANOVA, P=0.055 in leaves, P<0.01 in roots; detailed statistics in Table 2). Least-squares mean PCo1 and PCo2 are plotted with s.e.m. to show effects of year while controlling for other sources of variation using LMMs.

