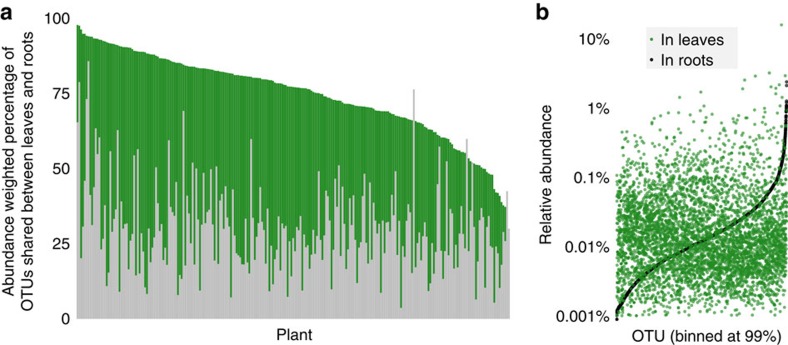
Figure 8. A large fraction of leaf OTUs were also observed within roots of the same plant.
(a) Each bar shows the total fraction of leaf (green) and root (grey) OTUs (binned at 99% sequence similarity) belonging to the ‘shared set' of OTUs that were observed in both organs within one plant (N=237 plants). (b) Root OTUs from across the relative abundance spectrum contributed to the bacterial leaf microbiome. All root OTUs are plotted in increasing order of their relative abundance in roots (black dots). For each OTU that was also observed in leaves, its relative abundance in the leaf microbiome is plotted above or below it (green dots).

