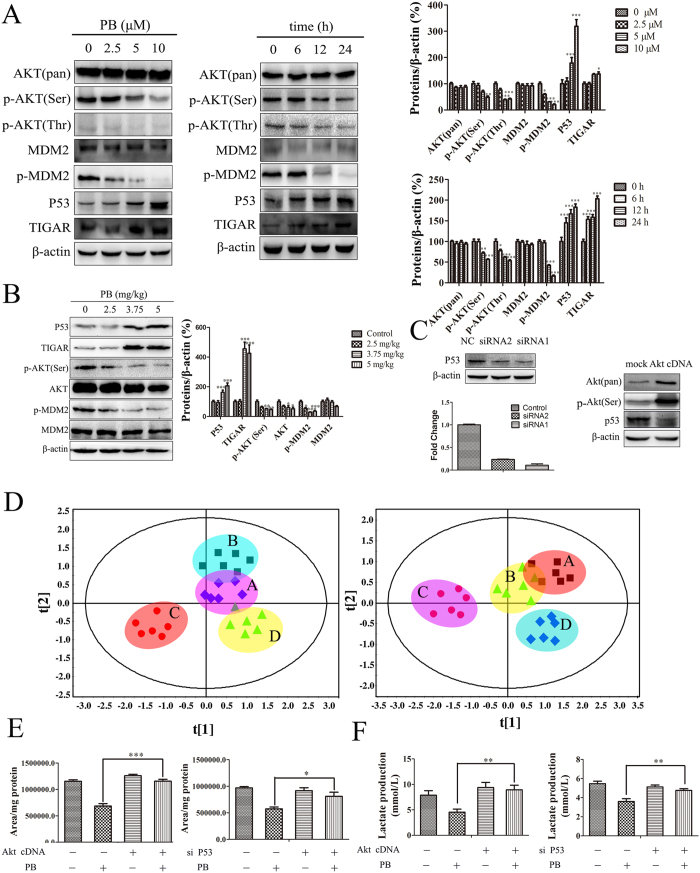
Figure 6. The effects of PB on metabolic pattern disruption were regulated through the Akt-P53 pathway.
(A) The protein levels of AKT, p-AKT (Ser), p-AKT (Thr), MDM2, p-MDM2, p53 and TIGAR in HepG2 cells treated with various concentrations of PB and 5 μM PB for different time intervals, as determined by western blotting. (B) The protein levels of AKT, p-AKT (Ser), MDM2, p-MDM2, p53 and TIGAR in mice treated with various concentrations of PB, as determined by western blotting. (C) The gene and protein levels of p53 and the protein expression of AKT and p-AKT (Ser) after HepG2 cells were transfected with p53 siRNA or Akt cDNA. (D) The metabolic profile data of HepG2 cells after treatment with 5 μM PB for 24 h in the presence or absence of P53 siRNA or Akt cDNA, as measured by GC-MS. (Left: A-mock cDNA B-Akt cDNA C-mock cDNA + PB treatment D-Akt cDNA + PB treatment Right: A-NC siRNA B-P53 siRNA C-NC siRNA + PB treatment D-P53 siRNA + PB treatment) (E) The change in peak area for lactate in HepG2 cells after treatment with 5 μM PB for 24 h in the presence or absence of P53 siRNA or Akt cDNA. (F) The lactate level in the medium of HepG2 cells after treatment with 5 μM PB for 24 h in the presence or absence of P53 siRNA or Akt cDNA, as determined by lactate assay kit.

