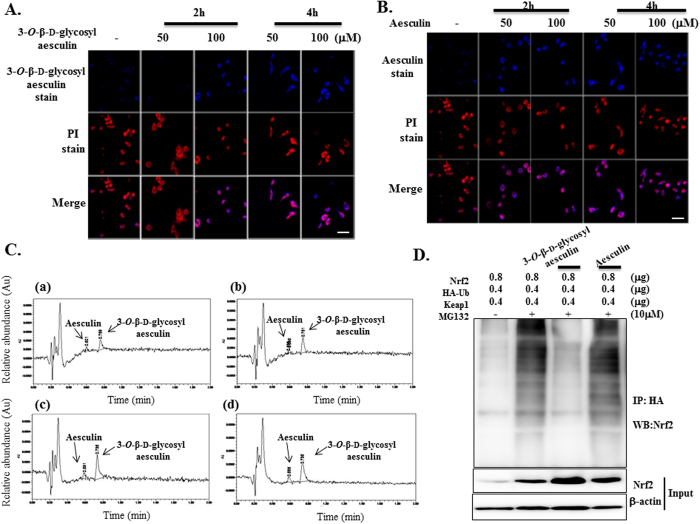
Figure 3. Absorption of 3-O-β-d-glycosyl aesculin and aesculin by RAW264.7 cells.
RAW 264.7 cells were treated with indicated amounts of 3-O-β-d-glycosyl aesculin (A) or aesculin (B), which were then fixed and stained with PI. The compounds and cells were shown blue and red, respectively, under a confocal microscope. Cells that absorbed 3-O-β-d-glycosyl aesculin or aesculin appeared pink (merge). Shown are representatives of 5 randomly picked microscopic fields for each treatment (bar = 500 μm). (C) HPLC chromatograms of the lysate of RAW 264.7 cells treated with 50 μM (a,b) or 100 μM (c,d) of 3-O-β-d-glycosyl aesculin (>99% purity). Arrows indicate the peaks for 3-O-β-d-glycosyl aesculin (83–87%) and aesculin (13–17%). (D) HEK 293 cells, transfected with indicated amounts of plasmids encoding Nrf2, HA-Ub, and Keap1, were treated with 20 μM of aesculin or 3-O-β-d-glycosyl aesculin in the presence of MG132. HA-Ub in cytosol was precipitated by the α-HA antibody, and the immune complex was analyzed by western blotting for Nrf2.

