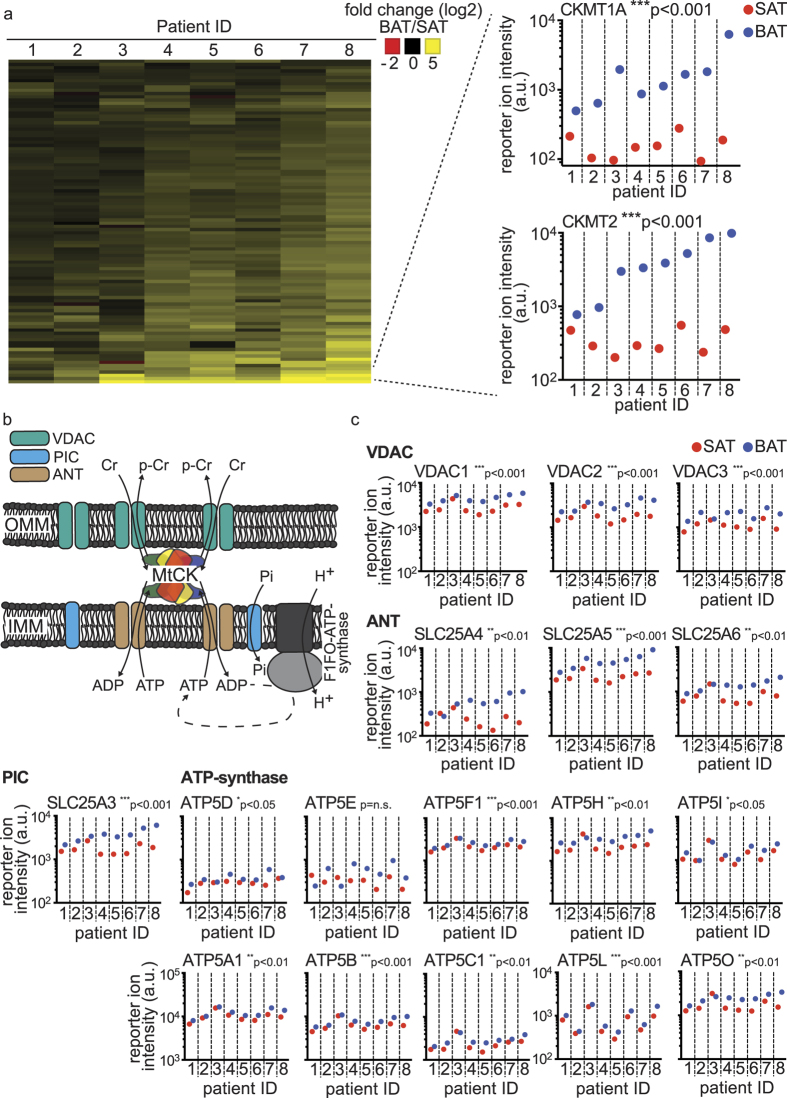
Figure 3. Mitochondrial creatine kinases and components of the mitochondrial interactosome are significantly enriched in BAT compared to the SAT samples.
(a) Heat-map of the fold changes (log2) between the paired SAT and BAT summed up protein intensities of the top 100 proteins enriched in the BAT across the patient samples. Detailed view of the summed up protein intensities of the mitochondrial creatine kinases CK-MT1A/B and CK-MT2.(b) Depiction of the mitochondrial interactosome, as described in Timohhina et al.23. (c) Summed up reporter ion intensities across the SAT and BAT patient sample pairs for the ANT, VDAC, PiC and the ATP synthase protein complexes. Data was analyzed by ratio paired t testing of the SAT and BAT sample pairs (n = 8); *p < 0.05; **p < 0.01; ***p < 0.001. OMM = outer mitochondrial membrane; IMM = inner mitochondrial membrane; MtCK = mitochondrial creatine kinase complex; VDAC = voltage-dependent anion channel; PiC = phosphate carrier; Pi = phosphate; ANT = adenine nucleotide translocator.

