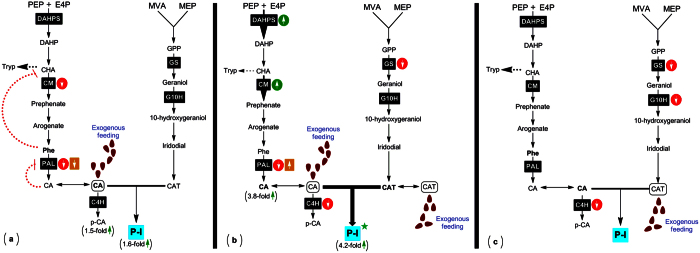
Figure 7.
Cascades depicting influence of different treatments on the fluxes through shikimate/phenylpropanoid and iridoid pathways; (a) CA, (b) CA+CAT and (c) CAT. The symbols were added and structures were coded with different colors to highlight the effects occurring on the biosynthesis of P-I under different treatments. Gene expressions were highlighted by using the green circle with arrow pointing up shows up-regulation while red circle with arrow pointing down shows down-regulation. Orange colored box with arrow pointing up and down indicate up-regulation and down-regulation of PAL enzyme, respectively. Red colored loop indicate feedback inhibition effect. Bold arrows indicate the up-regulation of respective step. Green colored star indicate high significant increase. CHA, chorismate; DAHP, 3-Deoxy-D-arabinoheptulosonate 7-phosphate; GPP, geranyl pyrophosphate; PEP, phosphoenolpyruvate; E4P, erythrose-4-phosphate.

