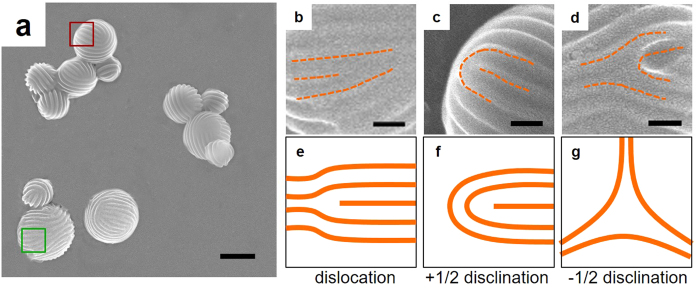
Figure 1. Striped patterns with defect features.
(a) SEM images of PBLG12100-b-PEG5000 /PS19400 aggregates. (b,e) dislocation; (c,f) +1/2 disclination; (d,g) −1/2 disclination. (b–d) are SEM images from experiments. (e–g) are schematic illustrations. (b,c) show the enlarged images of green and red squares in (a), respectively. Scale bars: 400 nm for (a) and 100 nm for (b–d).

