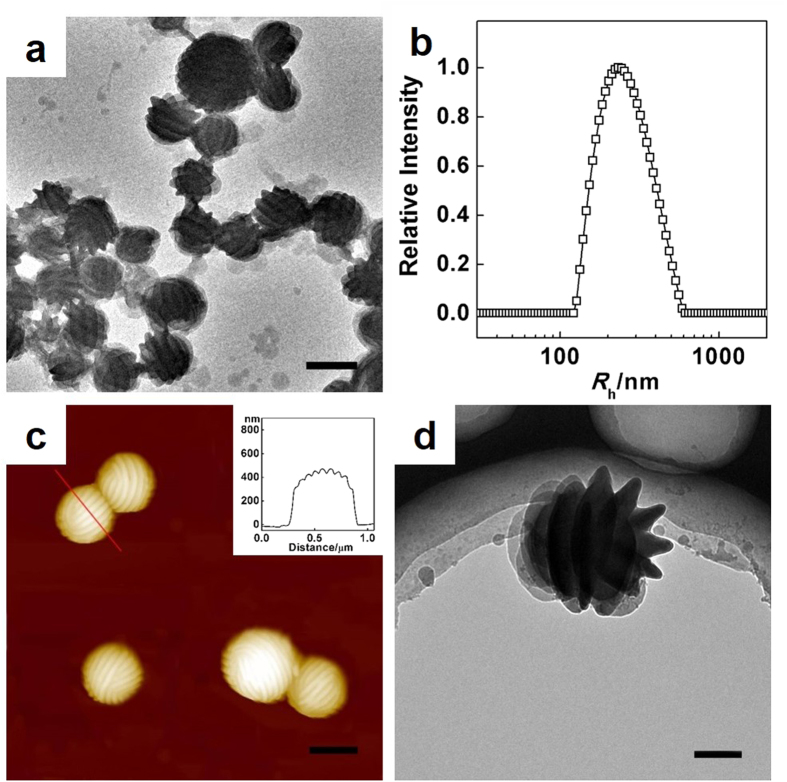
Figure 2. Typical strip-pattern-spheres observed in experiments.
(a) TEM, (c) AFM, and (d) cryo-TEM images of PBLG12100-b-PEG5000/PS19400 aggregates. (b) Rh distribution of the aggregates in solution obtained by DLS. The inset in (c) shows the height profile along the red line in (c). Scale bars: 400 nm for (a,c); 200 nm for (d).

