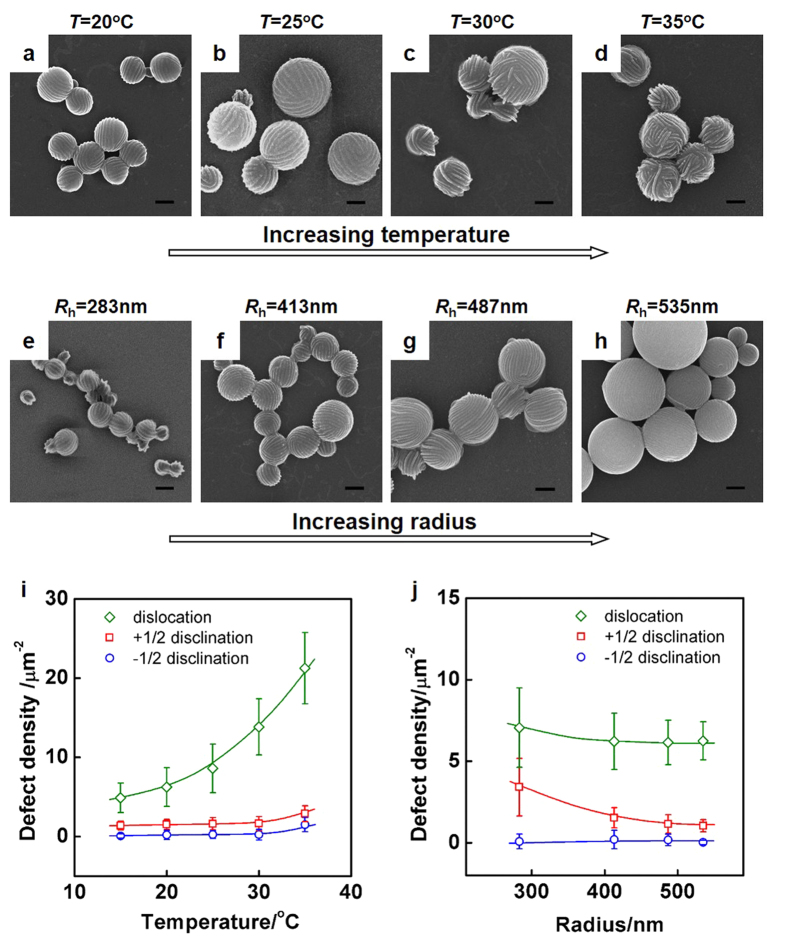
Figure 3. The effect of temperatures (T) and radii (Rh) on defect densities in experiments.
SEM images of PBLG-b-PEG/PS aggregates self-assembled at various temperatures (T) and radii (Rh): (a) T = 20 °C; (b) T = 25 °C; (c) T = 30 °C; (d) T = 35 °C; (e) Rh = 283 nm (fPBLG-b-PEG = 0.8); (f) Rh = 413 nm (fPBLG-b-PEG = 0.6); (g) Rh = 487 nm (fPBLG-b-PEG = 0.4); (h) Rh = 535 nm (fPBLG-b-PEG = 0.2). Scale bars: 400 nm. (i) Statistic defect densities as a function of temperature. (j) Statistic defect densities as a function of sphere radius. Rh data were obtained by DLS measurements.

