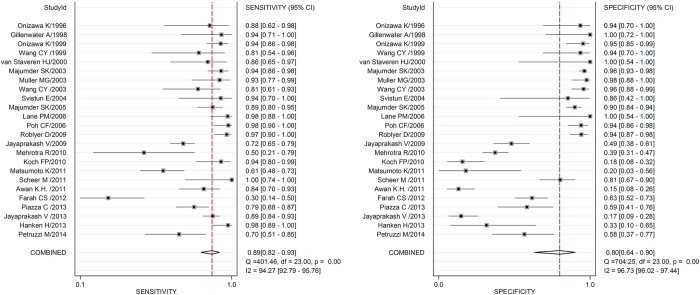
Figure 2. Forest plots of sensitivity and specificity of studies that employing autofluorescence in the diagnosis of OSCC and OPMD.
The solid circles indicate estimates of sensitivity and specificity for each study, and the size of each solid circle represents the sample size of each study. The error bars are 95% confidence intervals. OSCC: oral squamous cell carcinoma; OPMD: oral potentially malignant disorders.

