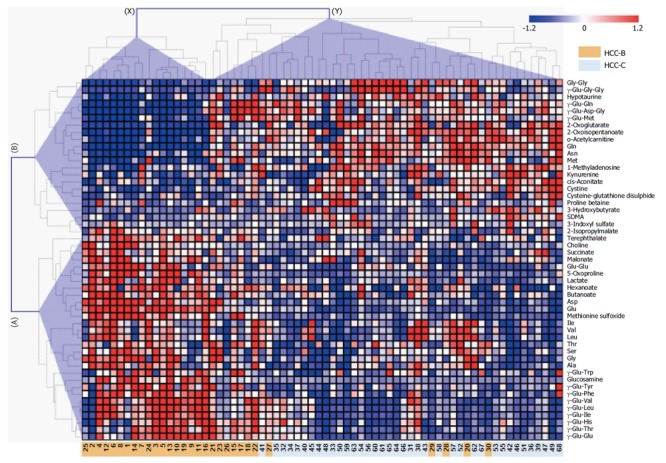
Figure 1.

Heat map of quantified metabolites showing significant differences (P < 0.05; Mann-Whitney test) between the hepatitis B virus-related hepatocellular carcinoma and hepatitis C virus-related hepatocellular carcinoma groups. The colors on the heat map were determined by the Z-score, reflecting the relative concentrations. The red, blue, and white colors indicate relatively higher, lower and average concentrations, respectively. The numbers at the bottom indicate the case number where orange and light blue indicate HCC-B and HCC-C, respectively. The clusters of metabolites and individuals are labeled A-B on the vertical axis and X–Y on the horizontal axis, respectively. HCC-B: Hepatitis B virus-related HCC; HCC-C: Hepatitis C virus-related HCC; HCC: Hepatocellular carcinoma.
