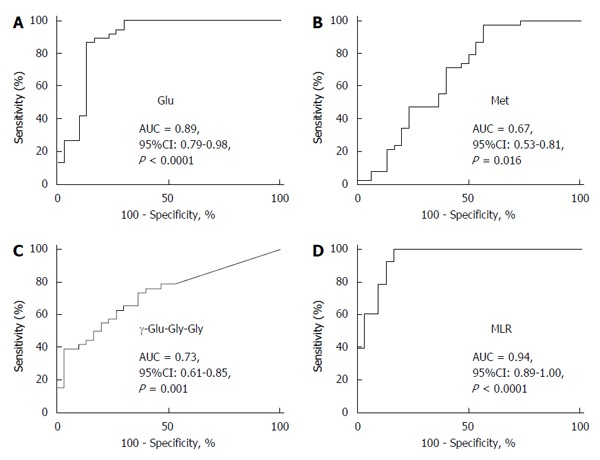
Figure 4.

Area under the curve values for glutamic acid (A), methionine (B) and γ-glutamyl-glycine-glycine (C), and the multiple logistic regression model incorporating the concentrations of these three metabolites (D) for discriminating hepatitis B virus-related hepatocellular carcinoma from hepatitis C virus-related hepatocellular carcinoma by receiver operating characteristic analysis. Glu: Glutamic acid; Met: Methionine; γ-Glu-Gly-Gly: γ-glutamyl-glycine-glycine; MLR: Multiple logistic regression; AUC: Area under the curve; HCC-B: Hepatitis B virus-related HCC; HCC-C: Hepatitis C virus-related HCC; HCC: Hepatocellular carcinoma.
