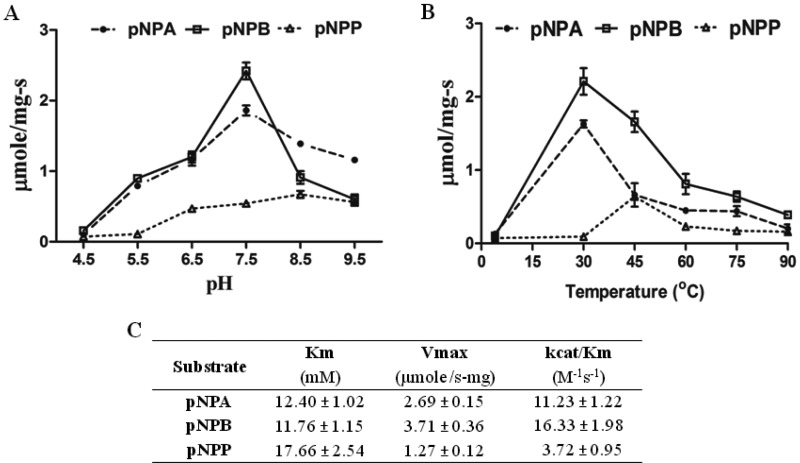
Figure 2. Ester hydrolase activity of ABHD2: kinetics, pH and temperature optima with pNP substrates.
(A) Highlights the optimum pH value showing maximum enzyme activity. (B) Represents the ABHD2 activity at different temperatures. (C) Purified ABHD2 enzyme of 0.67±0.06 mg/ml concentration was used for the analysis of esterase activity using pNPA, pNPB and pNPP as substrates. Data were analysed using graph pad prism 5. Data are mean values from three independent experiments with respective S.D. values.

