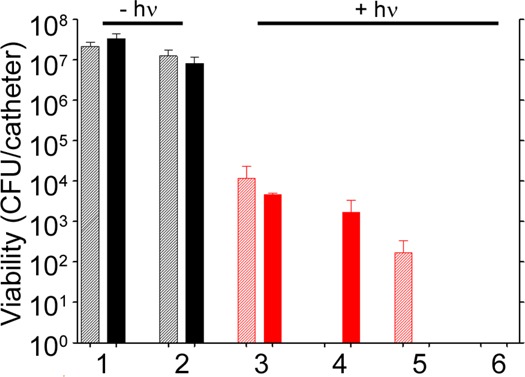
Figure 9.

Bacterial cell killing using a biofilm model. Experimental groups are (1) no treatment, (2) 5 μg/mL Dap, and irradiation plus (3) AuNC@PDA, (4) AuNC@PDA–aSpa, (5) AuNC@DapHi/PDA, and (6) AuNC@DapHi/PDA–aSpa. Killing was assessed at 0 h (striped bars) and 24 h (solid bars) after treatment. Black bars indicate non-irradiated groups, and red bars indicate irradiated groups.
