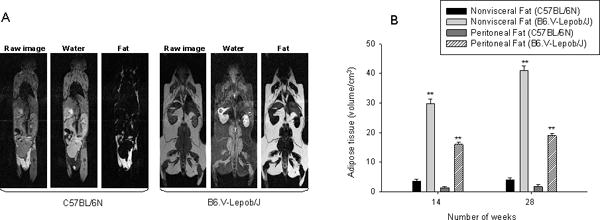
Figure 3.

Fat distribution assessment by MRI. A, whole body raw MRI image, water and fat images in C57BL/6N and B6.V-Lepob/J mice was performed at 14 and 28 weeks. The RCFF technique was used for image segmentations and reconstruction for water and fat separation. The semiautomatic ratio image analysis program delineated the visceral adipose tissue (dark gray), subcutaneous adipose tissue (white), air (black), and other tissues. B, adipose tissue volume assessment in mice. B, quantification of fat. Values represent Mean ± SEM, *p<0.05, **p<0.001, compared to C57BL/6 mice. Details are described in ‘materials and methods’ section.
