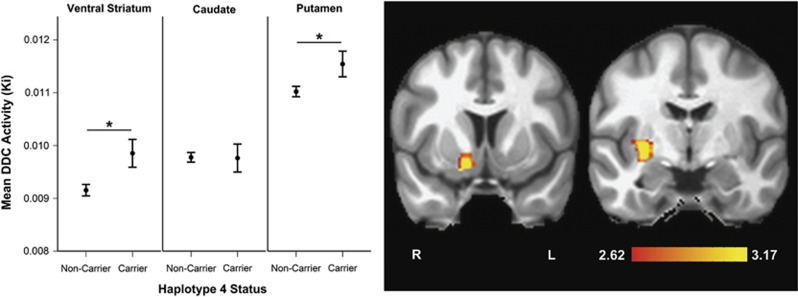
Figure 1.
DDC haplotype 4 effects. The graph shows region of interest (ROI) analyses with mean DDC activity values and standard errors for each ROI by haplotype 4 status. Multivariate Pillai's trace=0.1; F(3, 116)=4.31; p=0.006. Asterisks indicate p<0.05 for univariate comparisons. Coronal slices show results of post hoc voxel-wise analysis indicating locations of DDC effects in the striatum (at MNI Y=9 for ventral striatum and Y=−6 for caudate). Colored clusters represent areas where more copies of the DDC haplotype predicted greater DDC activity. Color bar indicates t-values, and data are displayed by radiological convention at a voxel-wise, uncorrected threshold of p<0.005.

