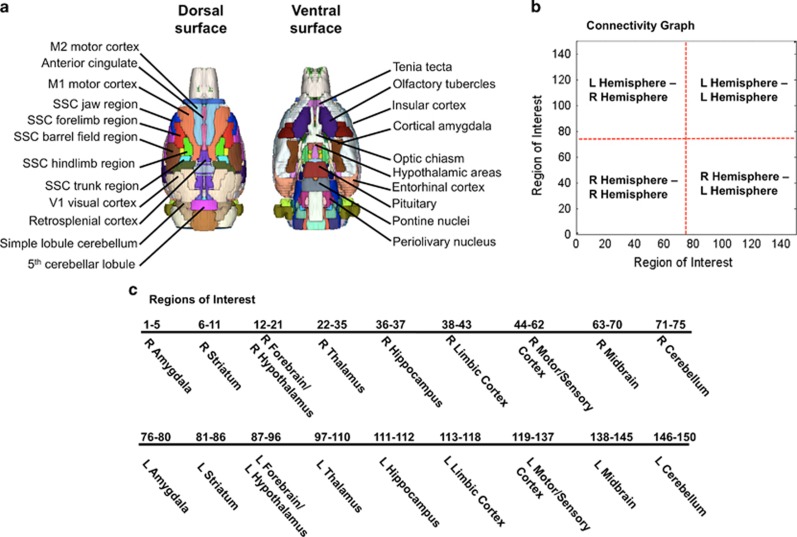
Figure 2.
Functional image parcellation based on a segmented atlas of rat brain. (a) Rat brain atlas in 3D view highlighting the dorsal and ventral surface brain areas. (b) Pairwise correlations of resting state signals from 150 regions of interest were assessed. Both intra- and inter-hemispheric comparison correlations are included in subsequent graphs, as indicated in the graph. (c) Regions analyzed for functional connectivity shown in the order in connectivity graph in (b). L, left; R, right; SSC, somatosensoricortical.

