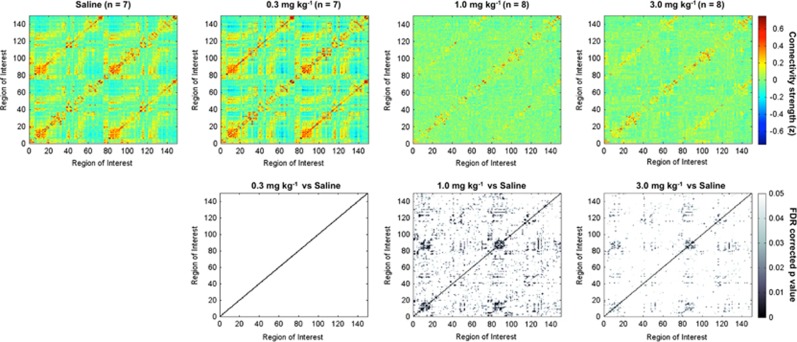
Figure 4.
Highest doses of 3,4-methylenedioxypyrovalerone (MDPV) cause widespread reductions of functional connectivity. Top row shows composite connectivity graphs for saline and three doses of MDPV (in mg/kg: 0.3, 1.0, and 3.0). Matrix entries are Fisher's z-transformed correlation coefficients. Color inside the graph indicates the value of the z, with red-yellow indicating high positive correlations, yellow-to-light blue low correlations, and dark blue anticorrelated signals. Bottom row shows graphs for statistical comparisons between saline and each of the MDPV treatment conditions. Gray-scale intensity indicates the level of statistical significance, with lightest colors approaching a cutoff of p=0.05 (false discovery rate (FDR) corrected). A full color version of this figure is available at the Neuropsychopharmacology journal online.

