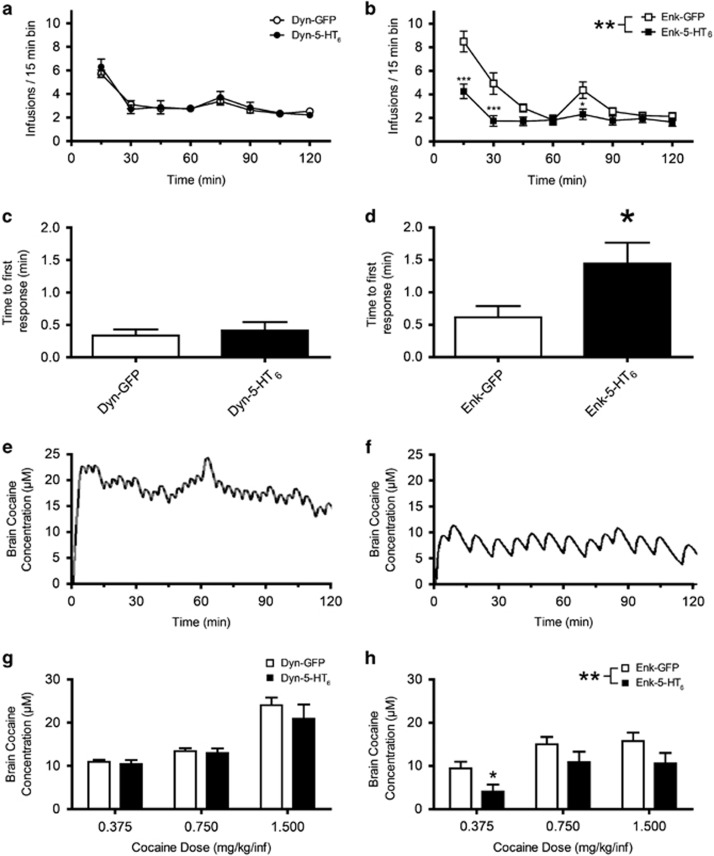
Figure 4.
Increasing expression of 5-HT6 receptor in the NAcSh iMSN changes patterns of cocaine taking and reduced the preferred brain cocaine concentration. (a) Average cocaine infusions (mean±SEM) per 15-min bin on mid-dose testing days shown for rats expressing either Dyn-GFP (n=7) or Dyn-5-HT6 (n=8) (two-way ANOVA, F(1,11)=2.56; p=0.14). (b) Average cocaine infusions (mean±SEM) per 15-min bin on mid-dose testing days shown for rats expressing either Enk-GFP (n=13) or Enk-5-HT6 (n=13) (two-way ANOVA, F(1,24)=9.07, p=0.006). (c) Average time to initial response in minutes for Dyn-GFP (n=7) and Dyn-5-HT6 (n=8) rats on all testing days (t-test, p=0.63). (d) Average time to initial response in minutes for Enk-GFP (n=13) and Enk-5-HT6 (n=14) rats on all testing days (t-test, p=0.035). Example brain cocaine concentration modeling at 0.75 mg/kg/infusion is shown for reference Enk-GFP (e) and Enk-5-HT6 (f). (g) Average estimated brain cocaine concentrations across doses (0.375, 0.75, and 1.5 mg/kg/infusion) for Dyn-5-HT6 rats (n=4–8 depending on dose) and Dyn-GFP rats (n=4–7 depending on dose) (two-way ANOVA, F(1,29)=1.94, p=0.18). (h) Average estimated brain cocaine concentrations across doses (0.375, 0.75, and 1.5 mg/kg/infusion) for Enk-5-HT6 rats (n=8–14 depending on dose) and Enk-GFP rats (n=8–14 depending on dose) (two-way ANOVA, F(1,54)=7.427, p=0.009). *p<0.05, **p<0.001, ***p<0.0001.

