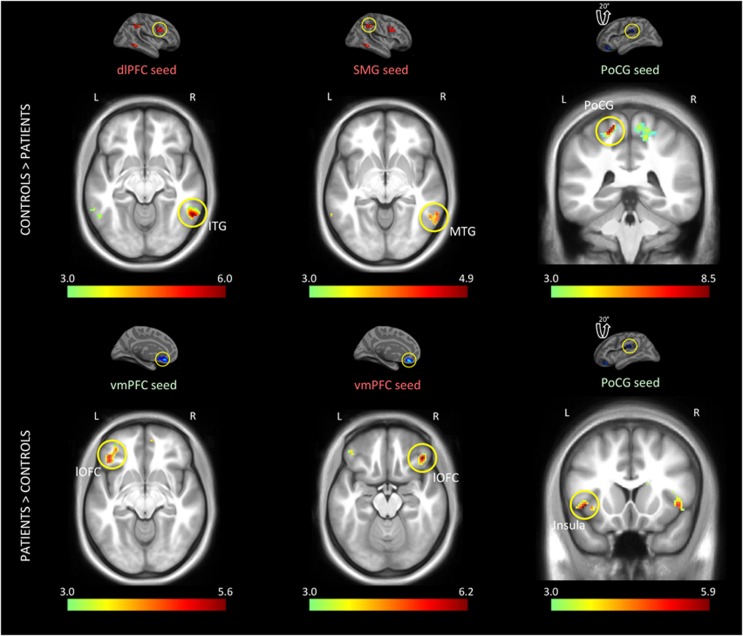
Figure 3.
Differences in functional connectivity between the groups at rest. Seed regions are indicated with a circle on their respective activation maps above the connectivity maps, which reflect the p-values derived from an ANOVA. Colored seed labels represent the effect from which the seed was defined; green: Correct vs Fix, red: Error vs Fix. Right dlPFC was more strongly coupled with right ITG in controls, whereas left vmPFC was more strongly coupled with bilateral lOFC in patients. In controls, right SMG showed stronger coupling with right MTG. Controls also showed enhanced coupling within left postcentral gyrus, whereas patients showed increased coupling between this region and left insula. Colorbar denotes the −log(p) value and all the effects are shown at p<0.001 for illustration purposes.

