
Fig. 3.
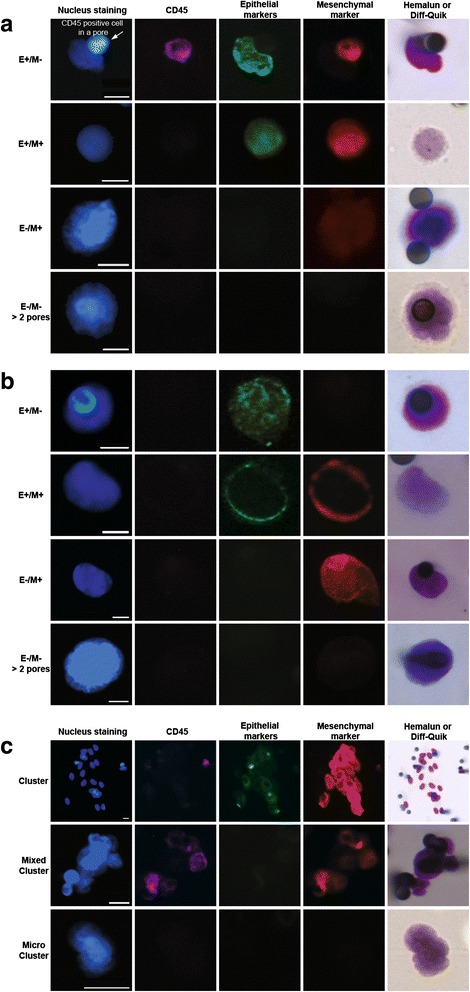
Examples of isolated CTCs (E+/M−, E+/M+, E−/M+, E−/M− > 2 pores respectively) identified by combined fluorescent staining and high-resolution cytomorphology in representative a NSCLC and b mPCa patients. c Examples of CTC clusters, mixed clusters and microclusters respectively in NSCLC and/or mPCa patients. Scale: white bars = 10 μm