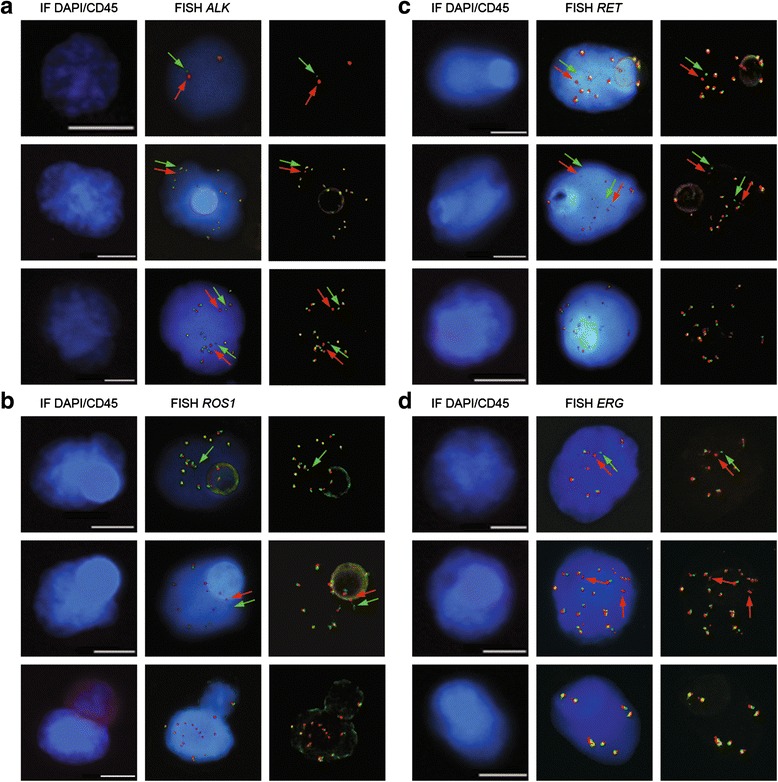
Fig. 5.

Examples of gene-rearrangement detection in filtration enriched-CTCs from NSCLC and mPCa patients by combined fluorescent staining and fluorescent in situ hybridization (FISH). a Example of ALK-rearrangement detection in NSCLC patients with an ALK-rearranged tumor. b Example of ROS1-rearrangement detection in NSCLC patients with a ROS1-rearranged tumor. c Example of RET-rearrangement detection in NSCLC patients with a RET-rearranged tumor. d Example of ERG-rearrangement detection in mPCa patients with an ERG-rearranged tumor. Gene rearrangements are shown by green and red. Scale: white bars = 10 μm
