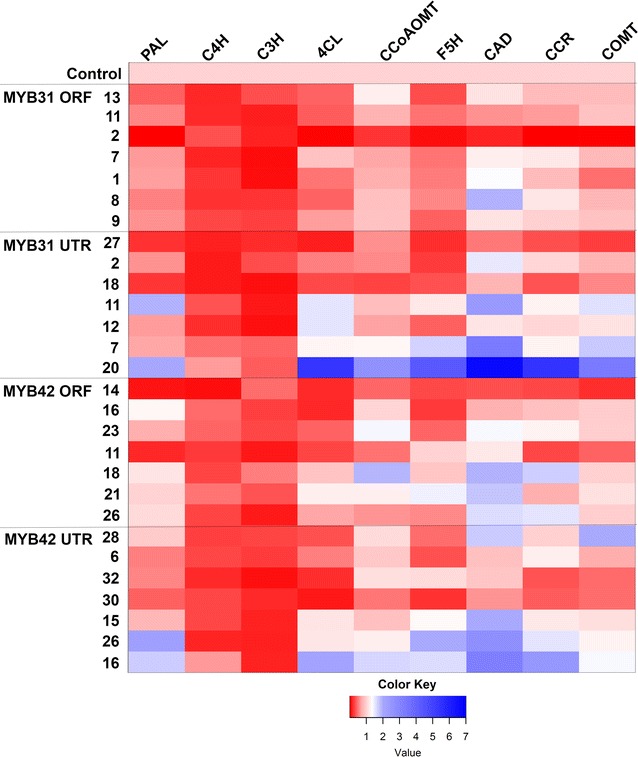
Fig. 2.

Quantitative PCR value heatmap of lignin biosynthetic genes in maturing internodes. Quantitative PCR ΔCt values of lignin biosynthesis genes in sugarcane expressing ZmMYB31 or ZmMYB42 normalized against GFP controls. Control n = 3. QPCR analysis of all tissue types and statistical analysis are displayed in Additional file 3
