
Figure EV1. Starvation induces a global change in locations of domain boundaries in Caulobacter crescentus .
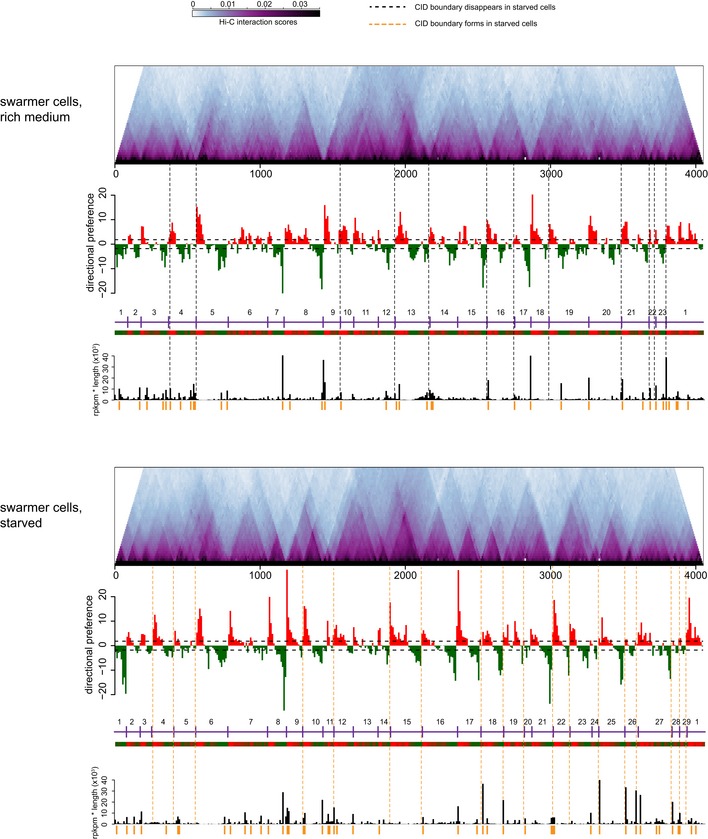
Hi‐C contact maps for intra‐chromosomal arm interactions rotated 45o clockwise. Directional preference plots were used to assign domain boundaries (see Appendix Supplementary Materials and Methods). Leftward and rightward preferences are shown as green and red bars, respectively. Abrupt transitions from leftward to rightward preference correspond to chromosomal interaction domain boundaries. Vertical black and orange dashed lines indicate boundaries specific to growing or starved cells, respectively. The directional preference plot and “rpkm * transcript length” plot corresponding to each condition are shown beneath the Hi‐C plots. For a complete tabulation of CID boundary locations, transcript lengths, and expression levels, see Dataset EV2.